Humana 2008 Annual Report Download - page 58
Download and view the complete annual report
Please find page 58 of the 2008 Humana annual report below. You can navigate through the pages in the report by either clicking on the pages listed below, or by using the keyword search tool below to find specific information within the annual report.-
 1
1 -
2
-
3
-
4
-
5
-
6
-
7
-
8
-
9
-
10
-
11
-
12
-
13
-
14
-
15
-
16
-
17
-
18
-
19
-
20
-
21
-
22
-
23
-
24
-
25
-
26
-
27
-
28
-
29
-
30
-
31
-
32
-
33
-
34
-
35
-
36
-
37
-
38
-
39
-
40
-
41
-
42
-
43
-
44
-
45
-
46
-
47
-
 48
48 -
 49
49 -
 50
50 -
 51
51 -
 52
52 -
 53
53 -
 54
54 -
 55
55 -
 56
56 -
 57
57 -
 58
58 -
 59
59 -
 60
60 -
 61
61 -
 62
62 -
 63
63 -
 64
64 -
 65
65 -
 66
66 -
 67
67 -
 68
68 -
69
-
70
-
71
-
72
-
73
-
74
-
75
-
76
-
77
-
78
-
79
-
80
-
81
-
82
-
83
-
84
-
85
-
86
-
87
-
88
-
89
-
90
-
91
-
92
-
93
-
94
-
95
-
96
-
97
-
98
-
99
-
100
-
101
-
102
-
103
-
104
-
105
-
106
-
107
-
108
-
109
-
110
-
111
-
112
-
113
-
114
-
115
-
116
-
117
-
118
-
119
-
120
-
121
-
122
-
123
-
124
-
125
-
126
-
127
-
128
-
129
-
130
-
131
-
132
-
133
-
134
-
135
-
136
 |
 |

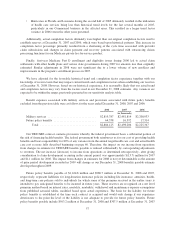
(1) IBNR represents an estimate of benefits payable for claims incurred but not reported (IBNR) at the balance
sheet date. The level of IBNR is primarily impacted by membership levels, medical claim trends and the
receipt cycle time, which represents the length of time between when a claim is initially incurred and when
the claim form is received (i.e. a shorter time span results in a lower IBNR).
(2) Military services benefits payable primarily results from the timing of the cost of providing health care
services to beneficiaries and the related reimbursement by the federal government as more fully described in
Note 2 to the consolidated financial statements included in Item 8.—Financial Statements and
Supplementary Data. A corresponding receivable is included in the base receivable in the previous
receivables table.
(3) Reported claims in process represents the estimated valuation of processed claims that are in the post claim
adjudication process, which consists of administrative functions such as audit and check batching and
handling, as well as amounts owed to our pharmacy benefit administrator which fluctuate due to bi-weekly
payments and the month-end cutoff.
(4) Other benefits payable include amounts owed to providers under capitated and risk sharing arrangements.
The increase in benefits payable during 2008 and 2007 primarily was due to the increase in IBNR from
growth in Medicare Advantage members and, to a lesser extent, benefit claims inflation, an increase in the
amount of processed but unpaid claims including pharmacy claims which fluctuate due to month-end cutoff, and
an increase in amounts owed to providers under capitated and risk sharing arrangements from Medicare
Advantage membership growth.
Cash Flow from Investing Activities
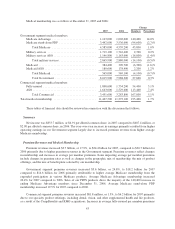
Cash consideration paid for acquisitions, net of cash acquired, of $422.9 million in 2008 and $493.5 million
in 2007 primarily related to the SecureHorizons, OSF, and Cariten acquisitions in 2008 and the CompBenefits
and KMG acquisitions in 2007. We reinvested a portion of our operating cash flows in investment securities,
primarily fixed income securities, totaling $685.5 million in 2008, $430.1 million in 2007, and $862.1 million in
2006. Our ongoing capital expenditures primarily relate to our information technology initiatives and
administrative facilities necessary for activities such as claims processing, billing and collections, medical
utilization review, and customer service. Total capital expenditures, excluding acquisitions, were $261.6 million
in 2008, $239.2 million in 2007, and $193.2 million in 2006. Excluding acquisitions, we expect total capital
expenditures in 2009 of approximately $260 million.
Cash Flow from Financing Activities
During 2008, the net repayment of $550 million under our credit agreement primarily related to amounts
repaid from the issuance of $750 million in senior notes offset by the $250 million financing of the Cariten
acquisition. Net borrowings of $350 million under our credit agreement during 2007 primarily related to the
financing of the CompBenefits and KMG acquisitions. During 2006, net borrowings of $250 million primarily
related to the funding of additional capital into certain subsidiaries in conjunction with growth in Medicare
revenues, offset by amounts repaid from the issuance of senior notes.
During 2008, we issued $500 million of 7.20% senior notes due June 15, 2018 and $250 million of 8.15%
senior notes due June 15, 2038. Our net proceeds, reduced for the original issue discount and cost of the offering,
were $742.6 million. We used the net proceeds from the offering for the repayment of the outstanding balance
under our credit agreement.
During 2006, we issued $500 million of 6.45% senior notes due June 1, 2016. Our net proceeds, reduced for
the original issue discount and cost of the offering, were $494.3 million. We used the proceeds from the offering
for the repayment of the outstanding balance under our credit agreement, which at the time of the issuance was
$200 million, and the repayment of our $300 million 7.25% senior notes which matured on August 1, 2006.
48