Humana 2008 Annual Report Download - page 91
Download and view the complete annual report
Please find page 91 of the 2008 Humana annual report below. You can navigate through the pages in the report by either clicking on the pages listed below, or by using the keyword search tool below to find specific information within the annual report.-
 1
1 -
2
-
3
-
4
-
5
-
6
-
7
-
8
-
9
-
10
-
11
-
12
-
13
-
14
-
15
-
16
-
17
-
18
-
19
-
20
-
21
-
22
-
23
-
24
-
25
-
26
-
27
-
28
-
29
-
30
-
31
-
32
-
33
-
34
-
35
-
36
-
37
-
38
-
39
-
40
-
41
-
42
-
43
-
44
-
45
-
46
-
47
-
48
-
49
-
50
-
51
-
52
-
53
-
54
-
55
-
56
-
57
-
58
-
59
-
60
-
61
-
62
-
63
-
64
-
65
-
66
-
67
-
68
-
69
-
70
-
71
-
72
-
73
-
74
-
75
-
76
-
77
-
78
-
79
-
80
-
 81
81 -
 82
82 -
 83
83 -
 84
84 -
 85
85 -
 86
86 -
 87
87 -
 88
88 -
 89
89 -
 90
90 -
 91
91 -
 92
92 -
 93
93 -
 94
94 -
 95
95 -
 96
96 -
 97
97 -
 98
98 -
 99
99 -
 100
100 -
 101
101 -
102
-
103
-
104
-
105
-
106
-
107
-
108
-
109
-
110
-
111
-
112
-
113
-
114
-
115
-
116
-
117
-
118
-
119
-
120
-
121
-
122
-
123
-
124
-
125
-
126
-
127
-
128
-
129
-
130
-
131
-
132
-
133
-
134
-
135
-
136
 |
 |

Humana Inc.
NOTES TO CONSOLIDATED FINANCIAL STATEMENTS—(Continued)
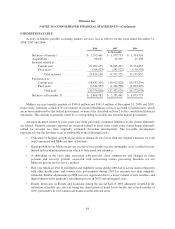
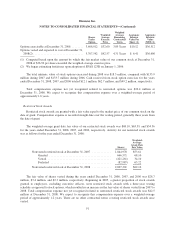
The detail of realized gains (losses) included with investment income was as follows for the years ended
December 31, 2008, 2007, and 2006:
2008 2007 2006
(in thousands)
Gross realized gains .................................... $ 56,879 $20,501 $ 81,052
Gross realized losses ................................... (136,296) (8,833) (13,556)
Net realized (losses) gains ........................... $ (79,417) $11,668 $ 67,496
Gross realized investment gains included gains from the sale of venture capital investments of $2.4 million
in 2008, $16.0 million in 2007, and $76.2 million in 2006.
Gross realized investment losses included other-than-temporary impairments of $103.1 million in 2008,
including credit related write-downs of $82.9 million and interest-related write-downs of $20.2 million. The
credit-related impairments in 2008 primarily were due to investments in Lehman Brothers Holdings Inc.
(Lehman) and certain of its subsidiaries, which filed for bankruptcy protection in 2008. The interest-related
impairments were due to declines in values of securities, primarily associated with the financial services industry,
for which we were uncertain of our intent to hold until recovery or maturity. There were no material other-than-
temporary impairments in 2007 and 2006.
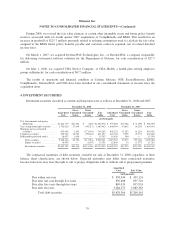
5. FAIR VALUE
The following table summarizes our fair value measurements at December 31, 2008 for financial assets
measured at fair value on a recurring basis:
Fair Value at
December 31,
2008
Fair Value Measurements Using
Quoted Prices in
Active Markets
for Identical
Assets
(Level 1)
Significant Other
Observable
Inputs
(Level 2)
Significant
Unobservable
Inputs
(Level 3)
(in thousands)
Assets
Cash and cash equivalents .................... $1,970,423 $1,970,423 $ — $ —
Investment securities ........................ 5,215,442 — 5,123,516 91,926
Securities lending invested collateral ........... 402,399 — 402,399 —
Total invested assets .................... $7,588,264 $1,970,423 $5,525,915 $91,926
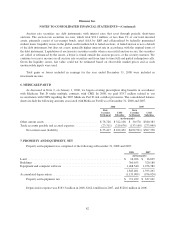
During the year ended December 31, 2008, the changes in the fair value of the assets measured using
significant unobservable inputs (Level 3) were comprised of the following:
2008
(in thousands)
Beginning balance at January 1, 2008 ................................ $18,698
Total gains or losses:
Realized in earnings .......................................... (3,410)
Unrealized in other comprehensive income ....................... 1,080
Purchases, sales, issuances, and settlements, net ........................ (19,965)
Transfers in and/or out of Level 3 ................................... 95,523
Balance at December 31, 2008 ..................................... $91,926
81