Humana 2008 Annual Report Download - page 94
Download and view the complete annual report
Please find page 94 of the 2008 Humana annual report below. You can navigate through the pages in the report by either clicking on the pages listed below, or by using the keyword search tool below to find specific information within the annual report.-
 1
1 -
2
-
3
-
4
-
5
-
6
-
7
-
8
-
9
-
10
-
11
-
12
-
13
-
14
-
15
-
16
-
17
-
18
-
19
-
20
-
21
-
22
-
23
-
24
-
25
-
26
-
27
-
28
-
29
-
30
-
31
-
32
-
33
-
34
-
35
-
36
-
37
-
38
-
39
-
40
-
41
-
42
-
43
-
44
-
45
-
46
-
47
-
48
-
49
-
50
-
51
-
52
-
53
-
54
-
55
-
56
-
57
-
58
-
59
-
60
-
61
-
62
-
63
-
64
-
65
-
66
-
67
-
68
-
69
-
70
-
71
-
72
-
73
-
74
-
75
-
76
-
77
-
78
-
79
-
80
-
81
-
82
-
83
-
 84
84 -
 85
85 -
 86
86 -
 87
87 -
 88
88 -
 89
89 -
 90
90 -
 91
91 -
 92
92 -
 93
93 -
 94
94 -
 95
95 -
 96
96 -
 97
97 -
 98
98 -
 99
99 -
 100
100 -
 101
101 -
 102
102 -
 103
103 -
 104
104 -
105
-
106
-
107
-
108
-
109
-
110
-
111
-
112
-
113
-
114
-
115
-
116
-
117
-
118
-
119
-
120
-
121
-
122
-
123
-
124
-
125
-
126
-
127
-
128
-
129
-
130
-
131
-
132
-
133
-
134
-
135
-
136
 |
 |

Humana Inc.
NOTES TO CONSOLIDATED FINANCIAL STATEMENTS—(Continued)
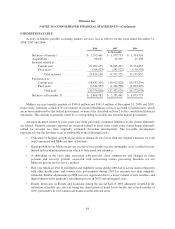
9. BENEFITS PAYABLE
Activity in benefits payable, excluding military services, was as follows for the years ended December 31,
2008, 2007 and 2006:
2008 2007 2006
(in thousands)
Balances at January 1 ................ $ 2,355,461 $ 1,979,733 $ 1,334,716
Acquisitions ........................ 96,021 41,029 21,198
Incurred related to:
Current year .................... 21,092,135 18,015,247 15,374,855
Prior years ..................... (268,027) (242,922) (178,998)
Total incurred .............. 20,824,108 17,772,325 15,195,857
Paid related to:
Current year .................... (18,832,301) (16,012,828) (13,532,139)
Prior years ..................... (1,544,507) (1,424,798) (1,039,899)
Total paid .................. (20,376,808) (17,437,626) (14,572,038)
Balances at December 31 ............. $ 2,898,782 $ 2,355,461 $ 1,979,733
Military services benefits payable of $306.8 million and $341.4 million at December 31, 2008 and 2007,
respectively, primarily consisted of our estimate of incurred healthcare services provided to beneficiaries which
are in turn reimbursed by the federal government, as more fully described in Note 2 to the consolidated financial
statements. This amount is generally offset by a corresponding receivable due from the federal government.
Amounts incurred related to prior years vary from previously estimated liabilities as the claims ultimately
are settled. Negative amounts reported for incurred related to prior years result from claims being ultimately
settled for amounts less than originally estimated (favorable development). The favorable development
experienced over the last three years is attributable to the following factors:
• Utilization of hospital and physician services ultimately was lower than our original estimates for both
our Commercial and Medicare lines of business.
• Rapid growth in our Medicare private fee-for-service product in new geographic areas resulted in more
limited historical information from which to base trend rate estimates.
• A shortening of the cycle time associated with provider claim submissions and changes in claim
payment and recovery patterns associated with outsourcing claims processing functions for our
Medicare private fee-for-service product.
• First-year Medicare Part D enrollment and eligibility issues during 2006 led to actual claim settlements
with other health plans and various state governments during 2007 for amounts less than originally
estimated. Similar adjustments in 2008 were not significant due to a lower volume of new enrollees and
improvements in the program’s enrollment process in 2007 and subsequent years.
• Finally, hurricanes in Florida and Louisiana during the second half of 2005 ultimately resulted in the
utilization of health care services being less than historical trend levels for the last several months of
2005, particularly in our Commercial business in the affected areas.
84