Humana 2008 Annual Report Download - page 21
Download and view the complete annual report
Please find page 21 of the 2008 Humana annual report below. You can navigate through the pages in the report by either clicking on the pages listed below, or by using the keyword search tool below to find specific information within the annual report.-
 1
1 -
2
-
3
-
4
-
5
-
6
-
7
-
8
-
9
-
10
-
 11
11 -
 12
12 -
 13
13 -
 14
14 -
 15
15 -
 16
16 -
 17
17 -
 18
18 -
 19
19 -
 20
20 -
 21
21 -
 22
22 -
 23
23 -
 24
24 -
 25
25 -
 26
26 -
 27
27 -
 28
28 -
 29
29 -
 30
30 -
 31
31 -
32
-
33
-
34
-
35
-
36
-
37
-
38
-
39
-
40
-
41
-
42
-
43
-
44
-
45
-
46
-
47
-
48
-
49
-
50
-
51
-
52
-
53
-
54
-
55
-
56
-
57
-
58
-
59
-
60
-
61
-
62
-
63
-
64
-
65
-
66
-
67
-
68
-
69
-
70
-
71
-
72
-
73
-
74
-
75
-
76
-
77
-
78
-
79
-
80
-
81
-
82
-
83
-
84
-
85
-
86
-
87
-
88
-
89
-
90
-
91
-
92
-
93
-
94
-
95
-
96
-
97
-
98
-
99
-
100
-
101
-
102
-
103
-
104
-
105
-
106
-
107
-
108
-
109
-
110
-
111
-
112
-
113
-
114
-
115
-
116
-
117
-
118
-
119
-
120
-
121
-
122
-
123
-
124
-
125
-
126
-
127
-
128
-
129
-
130
-
131
-
132
-
133
-
134
-
135
-
136
 |
 |

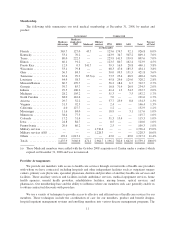
Membership
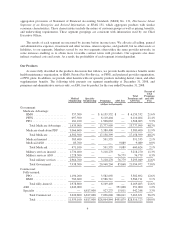
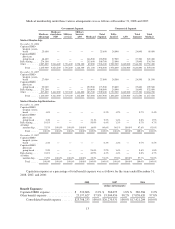
The following table summarizes our total medical membership at December 31, 2008, by market and
product:
Government Commercial
Medicare
Advantage
Medicare
stand-alone
PDP Medicaid
Military
services PPO HMO ASO Total
Percent
of Total
(in thousands)
Florida .................. 365.7 127.0 43.7 — 123.6 174.7 92.1 926.8 8.0%
Kentucky ................ 53.1 70.2 — — 143.9 34.7 507.2 809.1 7.0%
Texas ................... 80.0 222.5 — — 223.9 141.3 139.9 807.6 7.0%
Illinois .................. 66.1 91.2 — — 123.5 80.7 162.4 523.9 4.5%
Puerto Rico .............. 12.9 0.3 341.7 — 39.5 16.9 28.8 440.1 3.8%
Wisconsin ............... 53.1 79.8 — — 68.3 47.6 185.3 434.1 3.8%
Ohio ................... 56.5 84.5 — — 30.0 99.3 151.5 421.8 3.6%
Tennessee ............... 67.6 99.3 85.7(a) — 73.5 25.4 68.9 420.4 3.6%
Louisiana ............... 64.9 58.3 — — 45.8 29.6 129.6 328.2 2.8%
Missouri/Kansas .......... 60.7 170.7 — — 56.2 18.4 6.7 312.7 2.7%
Georgia ................. 39.7 85.7 — — 10.8 71.4 26.9 234.5 2.0%
Indiana ................. 29.5 106.2 — — 41.4 1.3 54.3 232.7 2.0%
Michigan ................ 28.2 105.2 — — 51.3 — 7.5 192.2 1.7%
North Carolina ........... 68.0 116.6 — — 7.0 — — 191.6 1.7%
Arizona ................. 29.7 52.2 — — 37.7 25.9 8.8 154.3 1.3%
Virginia ................. 51.5 92.5 — — 2.4 — — 146.4 1.3%
California ............... 4.0 127.7 — — 1.2 — — 132.9 1.2%
Mississippi .............. 11.6 84.0 — — 18.9 — 3.1 117.6 1.0%
Minnesota ............... 38.4 77.3 — — — — — 115.7 1.0%
Colorado ................ 17.2 31.4 — — 51.3 15.4 — 115.3 1.0%
Iowa ................... 24.8 84.7 — — 0.5 — — 110.0 1.0%
Pennsylvania ............. 20.6 86.2 — — 2.5 — — 109.3 1.0%
Military services .......... — — — 1,736.4 — — — 1,736.4 15.0%
Military services ASO ..... — — — 1,228.3 — — — 1,228.3 10.6%
Others .................. 192.1 1,013.1 — — 43.0 — 69.0 1,317.2 11.4%
Totals .................. 1,435.9 3,066.6 471.1 2,964.7 1,196.2 782.6 1,642.0 11,559.1 100.0%
(a) These Medicaid members were added with the October 2008 acquisition of Cariten under a contract which
expired on December 31, 2008 and was not renewed.
Provider Arrangements
We provide our members with access to health care services through our networks of health care providers
with whom we have contracted, including hospitals and other independent facilities such as outpatient surgery
centers, primary care physicians, specialist physicians, dentists and providers of ancillary health care services and
facilities. These ancillary services and facilities include ambulance services, medical equipment services, home
health agencies, mental health providers, rehabilitation facilities, nursing homes, optical services, and
pharmacies. Our membership base and the ability to influence where our members seek care generally enable us
to obtain contractual discounts with providers.
We use a variety of techniques to provide access to effective and efficient use of health care services for our
members. These techniques include the coordination of care for our members, product and benefit designs,
hospital inpatient management systems and enrolling members into various disease management programs. The
11