Humana 2008 Annual Report Download - page 50
Download and view the complete annual report
Please find page 50 of the 2008 Humana annual report below. You can navigate through the pages in the report by either clicking on the pages listed below, or by using the keyword search tool below to find specific information within the annual report.-
 1
1 -
2
-
3
-
4
-
5
-
6
-
7
-
8
-
9
-
10
-
11
-
12
-
13
-
14
-
15
-
16
-
17
-
18
-
19
-
20
-
21
-
22
-
23
-
24
-
25
-
26
-
27
-
28
-
29
-
30
-
31
-
32
-
33
-
34
-
35
-
36
-
37
-
38
-
39
-
 40
40 -
 41
41 -
 42
42 -
 43
43 -
 44
44 -
 45
45 -
 46
46 -
 47
47 -
 48
48 -
 49
49 -
 50
50 -
 51
51 -
 52
52 -
 53
53 -
 54
54 -
 55
55 -
 56
56 -
 57
57 -
 58
58 -
 59
59 -
 60
60 -
61
-
62
-
63
-
64
-
65
-
66
-
67
-
68
-
69
-
70
-
71
-
72
-
73
-
74
-
75
-
76
-
77
-
78
-
79
-
80
-
81
-
82
-
83
-
84
-
85
-
86
-
87
-
88
-
89
-
90
-
91
-
92
-
93
-
94
-
95
-
96
-
97
-
98
-
99
-
100
-
101
-
102
-
103
-
104
-
105
-
106
-
107
-
108
-
109
-
110
-
111
-
112
-
113
-
114
-
115
-
116
-
117
-
118
-
119
-
120
-
121
-
122
-
123
-
124
-
125
-
126
-
127
-
128
-
129
-
130
-
131
-
132
-
133
-
134
-
135
-
136
 |
 |
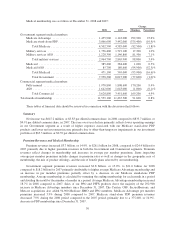
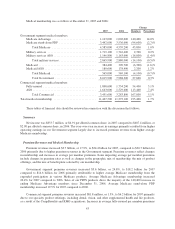
Commercial segment premium revenues increased $0.9 billion, or 14.5%, to $7.1 billion for 2008 primarily
due to our specialty product offerings, including dental, vision, and other supplemental health and life products,
as a result of the CompBenefits and KMG acquisitions in the fourth quarter of 2007, as well as strategic
line-of-business organic growth. Our fully-insured membership increased 9.4%, or 170,200 members, to
1,978,800 at December 31, 2008 compared to 1,808,600 at December 31, 2007. Excluding 83,100 fully-insured
members added with the acquisitions of Cariten and OSF, the increase primarily was due to membership gains in
Smart plans and other consumer offerings, individual, and small group product lines. We are targeting these
product lines for strategic growth in this segment.
Administrative Services Fees
Our administrative services fees were $451.9 million for 2008, an increase of $60.4 million, or 15.4%, from
$391.5 million for 2007, primarily due to higher rates, a shift in the mix of Commercial segment membership
towards higher rate groups, and the impact from acquisitions.
Investment Income
Investment income totaled $220.2 million for 2008, a decrease of $94.0 million from $314.2 million for
2007, primarily reflecting other-than-temporary impairments in our investment and securities lending portfolios
of $103.1 million recorded during 2008. Of the $103.1 million, $48.5 million was allocated to the Government
segment and $54.6 million was allocated to the Commercial segment. Excluding these realized losses, investment
income increased primarily due to higher average invested balances and net realized capital gains, partially offset
by lower interest rates. Higher average invested balances primarily resulted from the reinvestment of operating
cash flow and the acquired investment portfolio related to the KMG acquisition.
Other Revenue
Other revenue totaled $209.4 million for 2008, an increase of $59.5 million from $149.9 million for 2007.
The increase primarily was attributable to increased revenue from growth related to RightSourceRxSM, our mail-
order pharmacy.
Benefit Expenses
Consolidated benefit expense was $23.7 billion for 2008, an increase of $3.4 billion, or 17.0%, from $20.3
billion for 2007. The increase primarily was driven by an increase in Government segment benefit expense.
The consolidated benefit ratio for 2008 was 84.5%, a 150 basis point increase from 83.0% for 2007. The
increase primarily was attributable to a higher Government segment benefit ratio.
The Government segment’s benefit expenses increased $2.7 billion, or 17.9%, during 2008 compared to
2007 primarily due to an increase in the average number of Medicare Advantage members. The Government
segment’s benefit ratio for 2008 was 85.9%, a 210 basis point increase from 2007 of 83.8% primarily due to a
higher Medicare stand-alone PDP benefit ratio from higher prescription drug utilization and an increase in the
percentage of higher cost members in both our Standard and Enhanced plans.
The Commercial segment’s benefit expense increased $709.4 million, or 14.2%, from 2008 to 2007. This
increase primarily resulted from the CompBenefits and KMG acquisitions in the fourth quarter of 2007, an
increase in fully-insured membership and an increase in average per member claim costs primarily from the
effects of health care inflation. The benefit ratio for the Commercial segment of 80.3% for 2008 decreased 20
basis points from the 2007 benefit ratio of 80.5% primarily reflecting an increase in average members in our
specialty products from the acquisition of CompBenefits in the fourth quarter of 2007 and organic growth in our
individual line of business. Individual and specialty, primarily dental and vision, accounts generally carry a lower
benefit ratio and a higher SG&A expense ratio compared to larger accounts due to higher distribution costs. See
related SG&A expense ratio discussion in the following section.
40