Humana 2008 Annual Report Download - page 23
Download and view the complete annual report
Please find page 23 of the 2008 Humana annual report below. You can navigate through the pages in the report by either clicking on the pages listed below, or by using the keyword search tool below to find specific information within the annual report.-
 1
1 -
2
-
3
-
4
-
5
-
6
-
7
-
8
-
9
-
10
-
11
-
12
-
 13
13 -
 14
14 -
 15
15 -
 16
16 -
 17
17 -
 18
18 -
 19
19 -
 20
20 -
 21
21 -
 22
22 -
 23
23 -
 24
24 -
 25
25 -
 26
26 -
 27
27 -
 28
28 -
 29
29 -
 30
30 -
 31
31 -
 32
32 -
 33
33 -
34
-
35
-
36
-
37
-
38
-
39
-
40
-
41
-
42
-
43
-
44
-
45
-
46
-
47
-
48
-
49
-
50
-
51
-
52
-
53
-
54
-
55
-
56
-
57
-
58
-
59
-
60
-
61
-
62
-
63
-
64
-
65
-
66
-
67
-
68
-
69
-
70
-
71
-
72
-
73
-
74
-
75
-
76
-
77
-
78
-
79
-
80
-
81
-
82
-
83
-
84
-
85
-
86
-
87
-
88
-
89
-
90
-
91
-
92
-
93
-
94
-
95
-
96
-
97
-
98
-
99
-
100
-
101
-
102
-
103
-
104
-
105
-
106
-
107
-
108
-
109
-
110
-
111
-
112
-
113
-
114
-
115
-
116
-
117
-
118
-
119
-
120
-
121
-
122
-
123
-
124
-
125
-
126
-
127
-
128
-
129
-
130
-
131
-
132
-
133
-
134
-
135
-
136
 |
 |

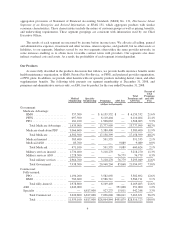
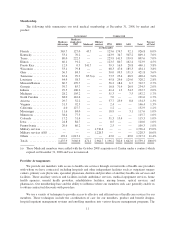
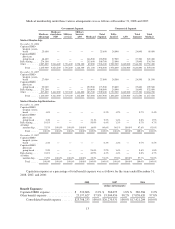
Medical membership under these various arrangements was as follows at December 31, 2008 and 2007:
Government Segment Commercial Segment
Medicare
Advantage
Medicare
stand-alone
PDP
Military
services
Military
Services
ASO Medicaid
Total
Segment
Fully-
Insured ASO
Total
Segment
Total
Medical
Medical Membership:
December 31, 2008
Capitated HMO
hospital system
based ....... 25,600 — — — — 25,600 24,000 — 24,000 49,600
Capitated HMO
physician
group based . . 48,400 — — — 146,500 194,900 27,500 — 27,500 222,400
Risk-sharing .... 274,100 — — — 235,600 509,700 25,000 — 25,000 534,700
Other ......... 1,087,800 3,066,600 1,736,400 1,228,300 89,000 7,208,100 1,902,300 1,642,000 3,544,300 10,752,400
Total ...... 1,435,900 3,066,600 1,736,400 1,228,300 471,100 7,938,300 1,978,800 1,642,000 3,620,800 11,559,100
December 31, 2007
Capitated HMO
hospital system
based ....... 27,000 — — — — 27,000 24,500 — 24,500 51,500
Capitated HMO
physician
group based . . 23,000 — — — 150,500 173,500 25,800 — 25,800 199,300
Risk-sharing .... 275,200 — — — 230,800 506,000 26,000 — 26,000 532,000
Other ......... 817,800 3,442,000 1,719,100 1,146,800 183,700 7,309,400 1,732,300 1,643,000 3,375,300 10,684,700
Total ...... 1,143,000 3,442,000 1,719,100 1,146,800 565,000 8,015,900 1,808,600 1,643,000 3,451,600 11,467,500
Medical Membership Distribution:
December 31, 2008
Capitated HMO
hospital system
based ....... 1.8% — — — — 0.3% 1.2% — 0.7% 0.4%
Capitated HMO
physician
group based . . 3.4% — — — 31.1% 2.5% 1.4% — 0.8% 1.9%
Risk-sharing .... 19.1% — — — 50.0% 6.4% 1.3% — 0.7% 4.7%
All other
membership . . 75.7% 100.0% 100.0% 100.0% 18.9% 90.8% 96.1% 100.0% 97.8% 93.0%
Total ...... 100.0% 100.0% 100.0% 100.0% 100.0% 100.0% 100.0% 100.0% 100.0% 100.0%
December 31, 2007
Capitated HMO
hospital system
based ....... 2.4% — — — — 0.3% 1.4% — 0.7% 0.5%
Capitated HMO
physician
group based . . 2.0% — — — 26.6% 2.2% 1.4% — 0.8% 1.8%
Risk-sharing .... 24.1% — — — 40.9% 6.3% 1.4% — 0.8% 4.7%
All other
membership . . 71.5% 100.0% 100.0% 100.0% 32.5% 91.2% 95.8% 100.0% 97.7% 93.0%
Total ...... 100.0% 100.0% 100.0% 100.0% 100.0% 100.0% 100.0% 100.0% 100.0% 100.0%
Capitation expense as a percentage of total benefit expense was as follows for the years ended December 31,
2008, 2007, and 2006:
2008 2007 2006
(dollars in thousands)
Benefit Expenses:
Capitated HMO expense ............... $ 510,606 2.2% $ 366,075 1.8% $ 382,584 2.2%
Other benefit expense ................. 23,197,627 97.8% 19,904,456 98.2% 17,038,620 97.8%
Consolidated benefit expense ....... $23,708,233 100.0% $20,270,531 100.0% $17,421,204 100.0%
13