Humana 2008 Annual Report Download - page 52
Download and view the complete annual report
Please find page 52 of the 2008 Humana annual report below. You can navigate through the pages in the report by either clicking on the pages listed below, or by using the keyword search tool below to find specific information within the annual report.-
 1
1 -
2
-
3
-
4
-
5
-
6
-
7
-
8
-
9
-
10
-
11
-
12
-
13
-
14
-
15
-
16
-
17
-
18
-
19
-
20
-
21
-
22
-
23
-
24
-
25
-
26
-
27
-
28
-
29
-
30
-
31
-
32
-
33
-
34
-
35
-
36
-
37
-
38
-
39
-
40
-
41
-
 42
42 -
 43
43 -
 44
44 -
 45
45 -
 46
46 -
 47
47 -
 48
48 -
 49
49 -
 50
50 -
 51
51 -
 52
52 -
 53
53 -
 54
54 -
 55
55 -
 56
56 -
 57
57 -
 58
58 -
 59
59 -
 60
60 -
 61
61 -
 62
62 -
63
-
64
-
65
-
66
-
67
-
68
-
69
-
70
-
71
-
72
-
73
-
74
-
75
-
76
-
77
-
78
-
79
-
80
-
81
-
82
-
83
-
84
-
85
-
86
-
87
-
88
-
89
-
90
-
91
-
92
-
93
-
94
-
95
-
96
-
97
-
98
-
99
-
100
-
101
-
102
-
103
-
104
-
105
-
106
-
107
-
108
-
109
-
110
-
111
-
112
-
113
-
114
-
115
-
116
-
117
-
118
-
119
-
120
-
121
-
122
-
123
-
124
-
125
-
126
-
127
-
128
-
129
-
130
-
131
-
132
-
133
-
134
-
135
-
136
 |
 |

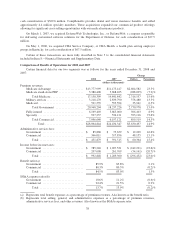
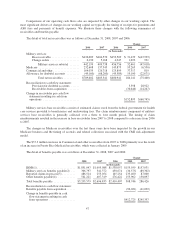
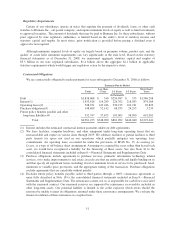
Comparison of Results of Operations for 2007 and 2006
Certain financial data for our two segments was as follows for the years ended December 31, 2007 and
2006:
2007 2006
Change
Dollars Percentage
(dollars in thousands)
Premium revenues:
Medicare Advantage ........................ $11,173,417 $ 8,499,064 $2,674,353 31.5%
Medicare stand-alone PDP ................... 3,668,425 3,050,304 618,121 20.3%
Total Medicare ......................... 14,841,842 11,549,368 3,292,474 28.5%
Military services ........................... 2,839,790 2,543,930 295,860 11.6%
Medicaid ................................. 555,594 520,520 35,074 6.7%
Total Government ...................... 18,237,226 14,613,818 3,623,408 24.8%
Fully-insured .............................. 5,663,000 5,704,378 (41,378) (0.7)%
Specialty ................................. 534,121 410,986 123,135 30.0%
Total Commercial ...................... 6,197,121 6,115,364 81,757 1.3%
Total ............................. $24,434,347 $20,729,182 $3,705,165 17.9%
Administrative services fees:
Government ............................... $ 73,659 $ 49,442 $ 24,217 49.0%
Commercial ............................... 317,856 291,769 26,087 8.9%
Total ................................. $ 391,515 $ 341,211 $ 50,304 14.7%
Income before income taxes:
Government ............................... $ 1,027,531 $ 513,845 $ 513,686 100.0%
Commercial ............................... 261,769 248,240 13,529 5.4%
Total ................................. $ 1,289,300 $ 762,085 $ 527,215 69.2%
Benefit ratios(a):
Government ............................... 83.8% 85.0% (1.2)%
Commercial ............................... 80.5% 81.7% (1.2)%
Total ................................. 83.0% 84.0% (1.0)%
SG&A expense ratios(b):
Government ............................... 11.2% 11.8% (0.6)%
Commercial ............................... 21.5% 20.0% 1.5%
Total ................................. 13.9% 14.3% (0.4)%
(a) Represents total benefit expenses as a percentage of premium revenues. Also known as the benefit ratio.
(b) Represents total selling, general, and administrative expenses as a percentage of premium revenues,
administrative services fees, and other revenues. Also known as the SG&A expense ratio.
42