Humana 2008 Annual Report Download - page 56
Download and view the complete annual report
Please find page 56 of the 2008 Humana annual report below. You can navigate through the pages in the report by either clicking on the pages listed below, or by using the keyword search tool below to find specific information within the annual report.-
 1
1 -
2
-
3
-
4
-
5
-
6
-
7
-
8
-
9
-
10
-
11
-
12
-
13
-
14
-
15
-
16
-
17
-
18
-
19
-
20
-
21
-
22
-
23
-
24
-
25
-
26
-
27
-
28
-
29
-
30
-
31
-
32
-
33
-
34
-
35
-
36
-
37
-
38
-
39
-
40
-
41
-
42
-
43
-
44
-
45
-
 46
46 -
 47
47 -
 48
48 -
 49
49 -
 50
50 -
 51
51 -
 52
52 -
 53
53 -
 54
54 -
 55
55 -
 56
56 -
 57
57 -
 58
58 -
 59
59 -
 60
60 -
 61
61 -
 62
62 -
 63
63 -
 64
64 -
 65
65 -
 66
66 -
67
-
68
-
69
-
70
-
71
-
72
-
73
-
74
-
75
-
76
-
77
-
78
-
79
-
80
-
81
-
82
-
83
-
84
-
85
-
86
-
87
-
88
-
89
-
90
-
91
-
92
-
93
-
94
-
95
-
96
-
97
-
98
-
99
-
100
-
101
-
102
-
103
-
104
-
105
-
106
-
107
-
108
-
109
-
110
-
111
-
112
-
113
-
114
-
115
-
116
-
117
-
118
-
119
-
120
-
121
-
122
-
123
-
124
-
125
-
126
-
127
-
128
-
129
-
130
-
131
-
132
-
133
-
134
-
135
-
136
 |
 |

a higher SG&A expense ratio than fully-insured business since there is no benefit expense or offsetting premium
revenue. Additionally, individual and smaller group accounts bear a higher SG&A expense ratio due to higher
distribution costs as compared to larger accounts.
Depreciation and Amortization
Depreciation and amortization for 2007 totaled $184.8 million compared to $148.6 million for 2006, an
increase of $36.2 million, or 24.4%. The increase primarily resulted from increased capital expenditures related
to the Medicare expansion.
Interest Expense
Interest expense was $68.9 million for 2007, compared to $63.1 million for 2006, an increase of $5.8
million, primarily due to higher average outstanding debt partially offset by lower interest rates.
Income Taxes
Our effective tax rate for 2007 of 35.3% compared to the effective tax rate of 36.0% for 2006. The decrease
is primarily due to a lower state tax rate. The lower state tax rate resulted from a shift in the geographic mix of
revenues to states with lower tax rates. See Note 10 to the consolidated financial statements included in Item 8.
—Financial Statements and Supplementary Data for a complete reconciliation of the federal statutory rate to the
effective tax rate.
Liquidity
Our primary sources of cash include receipts of premiums, ASO fees, and investment income, as well as
proceeds from the sale or maturity of our investment securities and from borrowings. Our primary uses of cash
include disbursements for claims payments, SG&A expenses, interest on borrowings, taxes, purchases of
investment securities, acquisitions, capital expenditures, and repayments on borrowings. Because premiums
generally are collected in advance of claim payments by a period of up to several months, our business normally
should produce positive cash flows during periods of increasing premiums and enrollment. Conversely, cash
flows would be negatively impacted during periods of decreasing premiums and enrollment. The use of operating
cash flows may be limited by regulatory requirements which require, among other items, that our regulated
subsidiaries maintain minimum levels of capital.
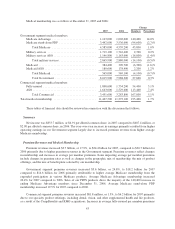
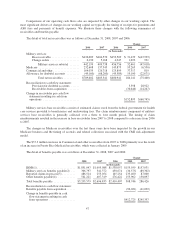
Cash and cash equivalents decreased to $1,970.4 million at December 31, 2008 from $2,040.5 million at
December 31, 2007. The change in cash and cash equivalents for the years ended December 31, 2008, 2007 and
2006 is summarized as follows:
2008 2007 2006
(in thousands)
Net cash provided by operating activities ............. $982,310 $ 1,224,262 $ 1,686,712
Net cash used in investing activities ................. (498,324) (1,845,391) (1,654,066)
Net cash (used in) provided by financing activities ...... (554,016) 921,278 975,642
(Decrease) increase in cash and cash equivalents ....... $ (70,030) $ 300,149 $ 1,008,288
Cash Flow from Operating Activities
The decrease in operating cash flows for 2008 compared to 2007 primarily resulted from decreased earnings
associated with higher stand-alone PDP claims. The decrease in operating cash flows for 2007 compared to 2006
resulted from the timing of cash flows associated with our Medicare Part D offerings, offset by Medicare
enrollment growth and improved earnings. During 2007, we paid $725.5 million to CMS under the risk corridor
terms of our 2006 contracts with CMS.
46