Humana 2008 Annual Report Download - page 74
Download and view the complete annual report
Please find page 74 of the 2008 Humana annual report below. You can navigate through the pages in the report by either clicking on the pages listed below, or by using the keyword search tool below to find specific information within the annual report.-
 1
1 -
2
-
3
-
4
-
5
-
6
-
7
-
8
-
9
-
10
-
11
-
12
-
13
-
14
-
15
-
16
-
17
-
18
-
19
-
20
-
21
-
22
-
23
-
24
-
25
-
26
-
27
-
28
-
29
-
30
-
31
-
32
-
33
-
34
-
35
-
36
-
37
-
38
-
39
-
40
-
41
-
42
-
43
-
44
-
45
-
46
-
47
-
48
-
49
-
50
-
51
-
52
-
53
-
54
-
55
-
56
-
57
-
58
-
59
-
60
-
61
-
62
-
63
-
 64
64 -
 65
65 -
 66
66 -
 67
67 -
 68
68 -
 69
69 -
 70
70 -
 71
71 -
 72
72 -
 73
73 -
 74
74 -
 75
75 -
 76
76 -
 77
77 -
 78
78 -
 79
79 -
 80
80 -
 81
81 -
 82
82 -
 83
83 -
 84
84 -
85
-
86
-
87
-
88
-
89
-
90
-
91
-
92
-
93
-
94
-
95
-
96
-
97
-
98
-
99
-
100
-
101
-
102
-
103
-
104
-
105
-
106
-
107
-
108
-
109
-
110
-
111
-
112
-
113
-
114
-
115
-
116
-
117
-
118
-
119
-
120
-
121
-
122
-
123
-
124
-
125
-
126
-
127
-
128
-
129
-
130
-
131
-
132
-
133
-
134
-
135
-
136
 |
 |

Recently Issued Accounting Pronouncements
For a discussion of recently issued accounting pronouncements, see Note 2 to the consolidated financial
statements included in Item 8.—Financial Statements and Supplementary Data.
ITEM 7A. QUANTITATIVE AND QUALITATIVE DISCLOSURES ABOUT MARKET RISK
The level of our pretax earnings is subject to market risk due to changes in investment income from our
fixed income portfolio and cash and cash equivalents which are partially offset by both our outstanding
indebtedness and the short-term duration of the fixed income investment portfolio.
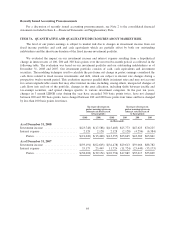
We evaluated the impact on our investment income and interest expense resulting from a hypothetical
change in interest rates of 100, 200 and 300 basis points over the next twelve-month period, as reflected in the
following table. The evaluation was based on our investment portfolio and our outstanding indebtedness as of
December 31, 2008 and 2007. Our investment portfolio consists of cash, cash equivalents and investment
securities. The modeling technique used to calculate the pro forma net change in pretax earnings considered the
cash flows related to fixed income investments and debt, which are subject to interest rate changes during a
prospective twelve-month period. This evaluation measures parallel shifts in interest rates and may not account
for certain unpredictable events that may effect interest income, including, among others, unexpected changes of
cash flows into and out of the portfolio, changes in the asset allocation, including shifts between taxable and
tax-exempt securities, and spread changes specific to various investment categories. In the past ten years,
changes in 3 month LIBOR rates during the year have exceeded 300 basis points twice, have not changed
between 200 and 300 basis points, have changed between 100 and 200 basis points four times and have changed
by less than 100 basis points four times.
Increase (decrease) in
pretax earnings given an
interest rate decrease of
X basis points
Increase (decrease) in
pretax earnings given an
interest rate increase of
X basis points
(300) (200) (100) 100 200 300
(in thousands)
As of December 31, 2008
Investment income ...................... $(23,748) $(17,588) $(15,483) $25,773 $47,625 $70,225
Interest expense ......................... 2,128 2,128 2,128 (2,128) (4,256) (6,384)
Pretax ............................. $(21,620) $(15,460) $(13,355) $23,645 $43,369 $63,841
As of December 31, 2007
Investment income ...................... $(93,191) $(62,603) $(34,478) $29,613 $59,066 $88,782
Interest expense ......................... 35,173 23,449 11,724 (11,724) (23,449) (35,173)
Pretax ............................. $(58,018) $(39,154) $(22,754) $17,889 $35,617 $53,609
64