Humana 2008 Annual Report Download - page 67
Download and view the complete annual report
Please find page 67 of the 2008 Humana annual report below. You can navigate through the pages in the report by either clicking on the pages listed below, or by using the keyword search tool below to find specific information within the annual report.-
 1
1 -
2
-
3
-
4
-
5
-
6
-
7
-
8
-
9
-
10
-
11
-
12
-
13
-
14
-
15
-
16
-
17
-
18
-
19
-
20
-
21
-
22
-
23
-
24
-
25
-
26
-
27
-
28
-
29
-
30
-
31
-
32
-
33
-
34
-
35
-
36
-
37
-
38
-
39
-
40
-
41
-
42
-
43
-
44
-
45
-
46
-
47
-
48
-
49
-
50
-
51
-
52
-
53
-
54
-
55
-
56
-
 57
57 -
 58
58 -
 59
59 -
 60
60 -
 61
61 -
 62
62 -
 63
63 -
 64
64 -
 65
65 -
 66
66 -
 67
67 -
 68
68 -
 69
69 -
 70
70 -
 71
71 -
 72
72 -
 73
73 -
 74
74 -
 75
75 -
 76
76 -
 77
77 -
78
-
79
-
80
-
81
-
82
-
83
-
84
-
85
-
86
-
87
-
88
-
89
-
90
-
91
-
92
-
93
-
94
-
95
-
96
-
97
-
98
-
99
-
100
-
101
-
102
-
103
-
104
-
105
-
106
-
107
-
108
-
109
-
110
-
111
-
112
-
113
-
114
-
115
-
116
-
117
-
118
-
119
-
120
-
121
-
122
-
123
-
124
-
125
-
126
-
127
-
128
-
129
-
130
-
131
-
132
-
133
-
134
-
135
-
136
 |
 |

• Hurricanes in Florida and Louisiana during the second half of 2005 ultimately resulted in the utilization
of health care services being less than historical trend levels for the last several months of 2005,
particularly in our Commercial business in the affected areas. This resulted in a larger trend factor
variance in 2006 versus the other years presented.
Additionally, actual completion factors ultimately were higher than our original completion factors used to
establish reserves at December 31, 2007 and 2006, which were based upon historical patterns. This increase in
completion factor percentage primarily resulted from a shortening of the cycle time associated with provider
claim submissions and changes in claim payment and recovery patterns associated with outsourcing claims
processing functions for our Medicare private fee-for-service product.
Finally, first-year Medicare Part D enrollment and eligibility issues during 2006 led to actual claim
settlements with other health plans and various state governments during 2007 for amounts less than originally
estimated. Similar adjustments in 2008 were not significant due to a lower volume of new enrollees and
improvements in the program’s enrollment process in 2007.
We have adjusted for the favorable historical trend and completion factor experience together with our
knowledge of recent events that may impact current trends and completion factors when establishing our reserves
at December 31, 2008. However, based on our historical experience, it is reasonably likely that our actual trend
and completion factors may vary from the factors used in our December 31, 2008 estimates. Any variances are
expected to be within the ranges previously presented in our sensitivity analysis table.
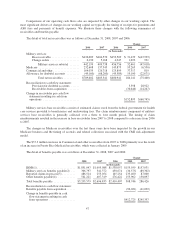
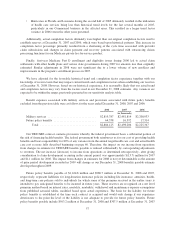
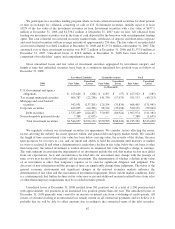
Benefit expenses associated with military services and provisions associated with future policy benefits
excluded from the previous table were as follows for the years ended December 31, 2008, 2007 and 2006:
2008 2007 2006
(in thousands)
Military services ................................. $2,819,787 $2,481,814 $2,208,033
Future policy benefits ............................. 64,338 16,392 17,314
Total ...................................... $2,884,125 $2,498,206 $2,225,347
Our TRICARE contract contains provisions whereby the federal government bears a substantial portion of
the risk of financing health benefits. The federal government both reimburses us for our cost of providing health
benefits and bears responsibility for 80% of any variance from the annual target health care cost and actual health
care cost as more fully described beginning on page 60. Therefore, the impact on our income from operations
from changes in estimate for TRICARE benefits payable is reduced substantially by corresponding adjustments
to revenues. The net increase (decrease) to income from operations as determined retrospectively, after giving
consideration to claim development occurring in the current period, was approximately $(13.7) million for 2007
and $1.1 million for 2006. The impact from changes in estimates for 2008 is not yet determinable as the amount
of prior period development recorded in 2009 will change as our December 31, 2008 benefits payable estimate
develops throughout 2009.
Future policy benefits payable of $1,164.8 million and $980.7 million at December 31, 2008 and 2007,
respectively, represent liabilities for long-duration insurance policies including life insurance, annuities, health,
and long-term care policies sold to individuals for which some of the premium received in the earlier years is
intended to pay anticipated benefits to be incurred in future years. These reserves are recognized on a net level
premium method based on interest rates, mortality, morbidity, withdrawal and maintenance expense assumptions
from published actuarial tables, modified based upon actual experience. The basis for the liability for future
policy benefits is established at the time each contract is acquired and would only change if our experience
deteriorates to the point the level of the liability is not adequate to provide for future policy benefits. Future
policy benefits payable include $503.2 million at December 31, 2008 and $307.5 million at December 31, 2007
57