Humana 2008 Annual Report Download - page 90
Download and view the complete annual report
Please find page 90 of the 2008 Humana annual report below. You can navigate through the pages in the report by either clicking on the pages listed below, or by using the keyword search tool below to find specific information within the annual report.-
 1
1 -
2
-
3
-
4
-
5
-
6
-
7
-
8
-
9
-
10
-
11
-
12
-
13
-
14
-
15
-
16
-
17
-
18
-
19
-
20
-
21
-
22
-
23
-
24
-
25
-
26
-
27
-
28
-
29
-
30
-
31
-
32
-
33
-
34
-
35
-
36
-
37
-
38
-
39
-
40
-
41
-
42
-
43
-
44
-
45
-
46
-
47
-
48
-
49
-
50
-
51
-
52
-
53
-
54
-
55
-
56
-
57
-
58
-
59
-
60
-
61
-
62
-
63
-
64
-
65
-
66
-
67
-
68
-
69
-
70
-
71
-
72
-
73
-
74
-
75
-
76
-
77
-
78
-
79
-
 80
80 -
 81
81 -
 82
82 -
 83
83 -
 84
84 -
 85
85 -
 86
86 -
 87
87 -
 88
88 -
 89
89 -
 90
90 -
 91
91 -
 92
92 -
 93
93 -
 94
94 -
 95
95 -
 96
96 -
 97
97 -
 98
98 -
 99
99 -
 100
100 -
101
-
102
-
103
-
104
-
105
-
106
-
107
-
108
-
109
-
110
-
111
-
112
-
113
-
114
-
115
-
116
-
117
-
118
-
119
-
120
-
121
-
122
-
123
-
124
-
125
-
126
-
127
-
128
-
129
-
130
-
131
-
132
-
133
-
134
-
135
-
136
 |
 |

Humana Inc.
NOTES TO CONSOLIDATED FINANCIAL STATEMENTS—(Continued)
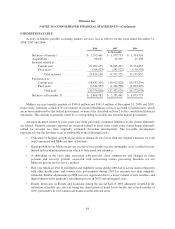
We participate in a securities lending program where we loan certain investment securities for short periods
of time in exchange for collateral, consisting of cash or U.S. Government securities, initially equal to at least
102% of the fair value of the investment securities on loan. Investment securities with a fair value of $437.1
million at December 31, 2008 and $1,336.1 million at December 31, 2007 were on loan. All collateral from
lending our investment securities was in the form of cash deposited by the borrower with an independent lending
agent. The cash collateral was invested in money market funds, certificates of deposit, and short-term corporate
and asset-backed securities with an average maturity of approximately 250 days. The fair value of securities held
as invested collateral was $402.4 million at December 31, 2008 and $1,337.0 million at December 31, 2007. The
amortized cost of these investment securities was $437.2 million at December 31, 2008 and $1,337.0 million at
December 31, 2007. Unrealized losses of $34.8 million at December 31, 2008 have been included as a
component of stockholders’ equity and comprehensive income.
Long-term investment securities with a fair value of $140.2 million at December 31, 2008 and $116.6
million at December 31, 2007 were on deposit at financial institutions in certain states pursuant to the respective
states’ insurance regulations.
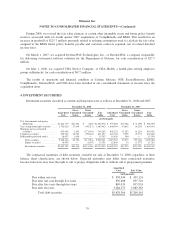
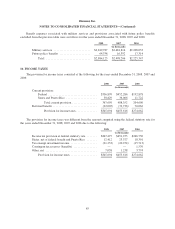
Gross unrealized losses and fair value aggregated by investment category and length of time that individual
securities have been in a continuous unrealized loss position were as follows at December 31, 2008 and 2007:
Less than 12 months 12 months or more Total
2008
Fair
Value
Unrealized
Losses
Fair
Value
Unrealized
Losses
Fair
Value
Unrealized
Losses
(in thousands)
U.S. Government and agency obligations ............ $ 163,626 $ (228) $ 4,297 $ (57) $ 167,923 $ (285)
Tax exempt municipal securities ................... 409,787 (22,238) 141,730 (17,975) 551,517 (40,213)
Mortgage and asset-backed securities ............... 542,051 (137,205) 126,354 (33,836) 668,405 (171,041)
Corporate securities ............................. 422,005 (64,786) 98,124 (35,056) 520,129 (99,842)
Debt securities ............................. 1,537,469 (224,457) 370,505 (86,924) 1,907,974 (311,381)
Non-redeemable preferred stocks .................. 7,388 (1,655) — — 7,388 (1,655)
Total investment securities .................... $1,544,857 $(226,112) $370,505 $(86,924) $1,915,362 $(313,036)
Less than 12 months 12 months or more Total
2007
Fair
Value
Unrealized
Losses
Fair
Value
Unrealized
Losses
Fair
Value
Unrealized
Losses
(in thousands)
U.S. Government and agency obligations .............. $ 46,272 $ (391) $169,599 $(1,718) $ 215,871 $ (2,109)
Tax exempt municipal securities ..................... 265,816 (4,098) 284,644 (2,147) 550,460 (6,245)
Mortgage and asset-backed securities ................. 118,474 (1,766) 137,139 (2,447) 255,613 (4,213)
Corporate securities ............................... 309,284 (8,161) 39,496 (1,016) 348,780 (9,177)
Debt securities ............................... 739,846 (14,416) 630,878 (7,328) 1,370,724 (21,744)
Non-redeemable preferred stocks .................... 6,400 (1,575) — — 6,400 (1,575)
Common stocks .................................. 3 (2) — — 3 (2)
Equity securities ............................. 6,403 (1,577) — — 6,403 (1,577)
Total investment securities ..................... $746,249 $(15,993) $630,878 $(7,328) $1,377,127 $(23,321)
Unrealized losses at December 31, 2008 resulted from 581 positions out of a total of 1,200 positions held
with approximately 142 positions in an unrealized loss position greater than one year. The unrealized losses at
December 31, 2008 primarily were caused by an increase in interest rates from a widening of credit spreads. All
issuers of securities trading at an unrealized loss remain current on all contractual payments, and we believe it is
probable that we will be able to collect amounts due according to the contractual terms of the debt securities.
After taking into account these and other factors, including the severity of the decline and our ability and intent to
hold these securities until recovery or maturity, we determined the unrealized losses on these investment
securities were temporary and, as such, no impairment was required.
80