Toyota 2006 Annual Report Download - page 101
Download and view the complete annual report
Please find page 101 of the 2006 Toyota annual report below. You can navigate through the pages in the report by either clicking on the pages listed below, or by using the keyword search tool below to find specific information within the annual report.-
 1
1 -
2
-
3
-
4
-
5
-
6
-
7
-
8
-
9
-
10
-
11
-
12
-
13
-
14
-
15
-
16
-
17
-
18
-
19
-
20
-
21
-
22
-
23
-
24
-
25
-
26
-
27
-
28
-
29
-
30
-
31
-
32
-
33
-
34
-
35
-
36
-
37
-
38
-
39
-
40
-
41
-
42
-
43
-
44
-
45
-
46
-
47
-
48
-
49
-
50
-
51
-
52
-
53
-
54
-
55
-
56
-
57
-
58
-
59
-
60
-
61
-
62
-
63
-
64
-
65
-
66
-
67
-
68
-
69
-
70
-
71
-
72
-
73
-
74
-
75
-
76
-
77
-
78
-
79
-
80
-
81
-
82
-
83
-
84
-
85
-
86
-
87
-
88
-
89
-
90
-
 91
91 -
 92
92 -
 93
93 -
 94
94 -
 95
95 -
 96
96 -
 97
97 -
 98
98 -
 99
99 -
 100
100 -
 101
101 -
 102
102 -
 103
103 -
 104
104 -
 105
105 -
 106
106 -
 107
107 -
 108
108 -
 109
109 -
 110
110 -
 111
111 -
112
-
113
-
114
-
115
-
116
-
117
-
118
-
119
-
120
-
121
-
122
-
123
-
124
-
125
-
126
-
127
-
128
-
129
-
130
-
131
-
132
-
133
-
134
-
135
-
136
-
137
-
138
-
139
-
140
 |
 |
99
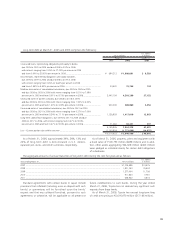
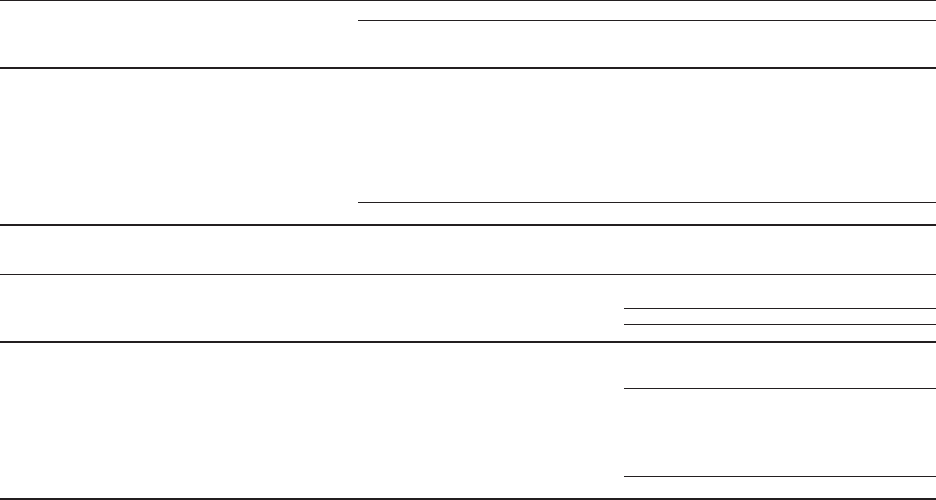
The contractual maturities of retail receivables, the future minimum lease payments on finance leases and wholesale and other
dealer loans at March 31, 2006 are summarized as follows:
Yen in millions U.S. dollars in millions
Wholesale Wholesale
Finance and other Finance and other
Years ending March 31, Retail lease dealer loans Retail lease dealer loans
2007........................................................................ ¥1,692,889 ¥194,384 ¥1,664,365 $14,411 $1,655 $14,168
2008........................................................................ 1,497,693 124,726 99,217 12,749 1,062 845
2009........................................................................ 1,227,787 99,718 95,581 10,452 849 814
2010........................................................................ 820,275 37,035 53,532 6,983 315 456
2011........................................................................ 404,888 15,239 56,384 3,447 129 480
Thereafter ................................................................ 287,290 1,623 29,735 2,446 14 253
¥5,930,822 ¥472,725 ¥1,998,814 $50,488 $4,024 $17,016
Finance leases consist of the following:
U.S. dollars
Yen in millions in millions
March 31, March 31,
2005 2006 2006
Minimum lease payments ..........................................................................................................¥485,696 ¥ 472,725 $4,024
Estimated unguaranteed residual values ..................................................................................... 271,036 268,555 2,286
756,732 741,280 6,310
Deferred origination costs .......................................................................................................... 1,900 1,462 12
Less—Unearned income............................................................................................................. (71,702) (102,241) (870)
Less—Allowance for credit losses ............................................................................................... (6,502) (6,140) (52)
Finance leases, net......................................................................................................... ¥680,428 ¥ 634,361 $5,400
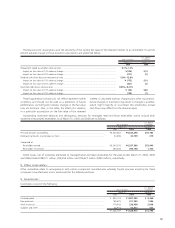
Toyota maintains a program to sell retail and lease finance
receivables. Under the program, Toyota’s securitization trans-
actions are generally structured as qualifying SPEs (“QSPE”s),
thus Toyota achieves sale accounting treatment under the
provisions of FAS 140. Toyota recognizes a gain or loss on the
sale of the finance receivables upon the transfer of the receiv-
ables to the securitization trusts structured as a QSPE. Toyota
retains servicing rights and earns a contractual servicing fee of
1% per annum on the total monthly outstanding principal
balance of the related securitized receivables. In a subordinat-
ed capacity, Toyota retains interest-only strips, subordinated
securities, and cash reserve funds in these securitizations, and
these retained interests are held as restricted assets subject to
limited recourse provisions and provide credit enhancement to
the senior securities in Toyota’s securitization transactions. The
retained interests are not available to satisfy any obligations of
Toyota. Investors in the securitizations have no recourse to
Toyota beyond Toyota’s retained subordinated interests and
any amounts drawn on the revolving liquidity notes. Toyota’s
exposure to these retained interests exists until the associated
securities are paid in full. Investors do not have recourse to
other assets held by Toyota for failure of obligors on the
receivables to pay when due or otherwise.