Toyota 2006 Annual Report Download - page 30
Download and view the complete annual report
Please find page 30 of the 2006 Toyota annual report below. You can navigate through the pages in the report by either clicking on the pages listed below, or by using the keyword search tool below to find specific information within the annual report.-
 1
1 -
2
-
3
-
4
-
5
-
6
-
7
-
8
-
9
-
10
-
11
-
12
-
13
-
14
-
15
-
16
-
17
-
18
-
19
-
 20
20 -
 21
21 -
 22
22 -
 23
23 -
 24
24 -
 25
25 -
 26
26 -
 27
27 -
 28
28 -
 29
29 -
 30
30 -
 31
31 -
 32
32 -
 33
33 -
 34
34 -
 35
35 -
 36
36 -
 37
37 -
 38
38 -
 39
39 -
 40
40 -
41
-
42
-
43
-
44
-
45
-
46
-
47
-
48
-
49
-
50
-
51
-
52
-
53
-
54
-
55
-
56
-
57
-
58
-
59
-
60
-
61
-
62
-
63
-
64
-
65
-
66
-
67
-
68
-
69
-
70
-
71
-
72
-
73
-
74
-
75
-
76
-
77
-
78
-
79
-
80
-
81
-
82
-
83
-
84
-
85
-
86
-
87
-
88
-
89
-
90
-
91
-
92
-
93
-
94
-
95
-
96
-
97
-
98
-
99
-
100
-
101
-
102
-
103
-
104
-
105
-
106
-
107
-
108
-
109
-
110
-
111
-
112
-
113
-
114
-
115
-
116
-
117
-
118
-
119
-
120
-
121
-
122
-
123
-
124
-
125
-
126
-
127
-
128
-
129
-
130
-
131
-
132
-
133
-
134
-
135
-
136
-
137
-
138
-
139
-
140
 |
 |
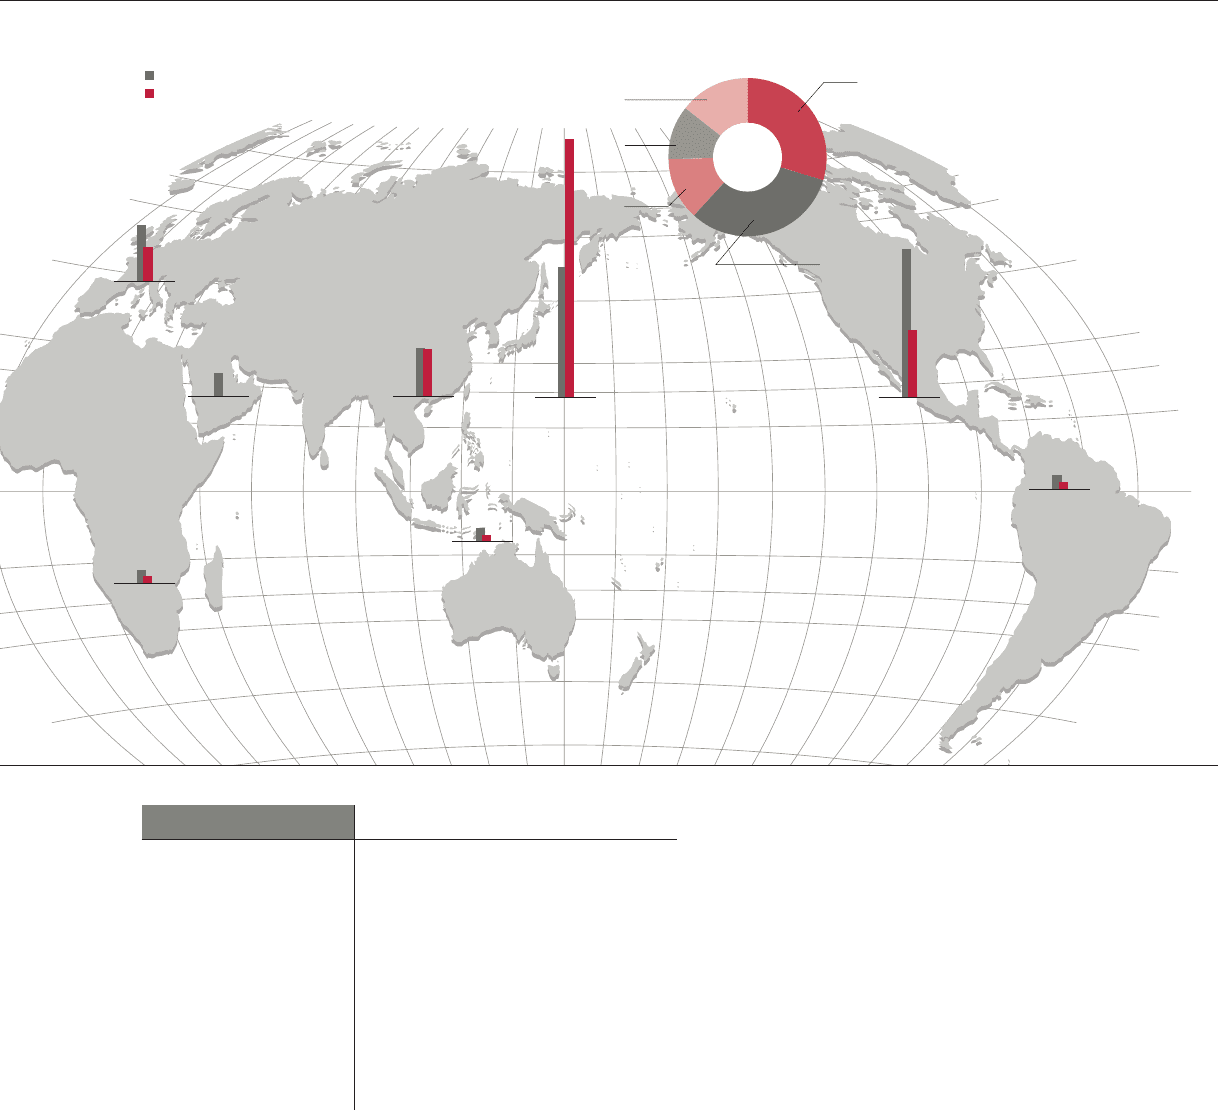
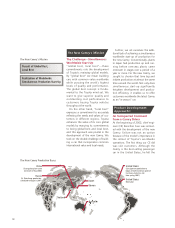
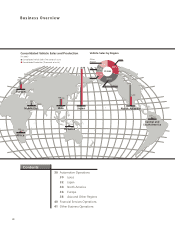
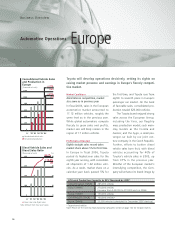
Europe
1,023
623
Oceania
251113
Japan
2,364
4,684
Asia
880 836
North America
2,556
1,201
Central and
South America
233 122
Africa
253 132
Middle East
405
Consolidated Vehicle Sales (Thousands of units)
Consolidated Production (Thousands of units)
Consolidated Vehicle Sales and Production
(FY 2006)
28
Business Overview
Vehicle Sales by Region
FY 2006
14.4%
12.8%
32.1%
29.7%
Japan
North America
Europe
Other
Regions
Asia 11.0%
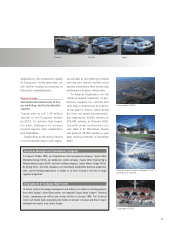
30 Automotive Operations
30 Lexus
32 Japan
34 North America
36 Europe
38 Asia and Other Regions
40 Financial Services Operations
41 Other Business Operations
Contents