Toyota 2006 Annual Report Download - page 105
Download and view the complete annual report
Please find page 105 of the 2006 Toyota annual report below. You can navigate through the pages in the report by either clicking on the pages listed below, or by using the keyword search tool below to find specific information within the annual report.-
 1
1 -
2
-
3
-
4
-
5
-
6
-
7
-
8
-
9
-
10
-
11
-
12
-
13
-
14
-
15
-
16
-
17
-
18
-
19
-
20
-
21
-
22
-
23
-
24
-
25
-
26
-
27
-
28
-
29
-
30
-
31
-
32
-
33
-
34
-
35
-
36
-
37
-
38
-
39
-
40
-
41
-
42
-
43
-
44
-
45
-
46
-
47
-
48
-
49
-
50
-
51
-
52
-
53
-
54
-
55
-
56
-
57
-
58
-
59
-
60
-
61
-
62
-
63
-
64
-
65
-
66
-
67
-
68
-
69
-
70
-
71
-
72
-
73
-
74
-
75
-
76
-
77
-
78
-
79
-
80
-
81
-
82
-
83
-
84
-
85
-
86
-
87
-
88
-
89
-
90
-
91
-
92
-
93
-
94
-
 95
95 -
 96
96 -
 97
97 -
 98
98 -
 99
99 -
 100
100 -
 101
101 -
 102
102 -
 103
103 -
 104
104 -
 105
105 -
 106
106 -
 107
107 -
 108
108 -
 109
109 -
 110
110 -
 111
111 -
 112
112 -
 113
113 -
 114
114 -
 115
115 -
116
-
117
-
118
-
119
-
120
-
121
-
122
-
123
-
124
-
125
-
126
-
127
-
128
-
129
-
130
-
131
-
132
-
133
-
134
-
135
-
136
-
137
-
138
-
139
-
140
 |
 |

103
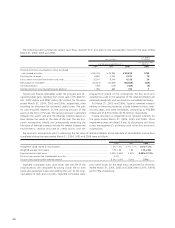
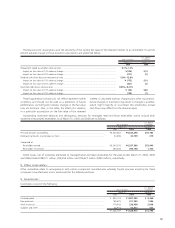
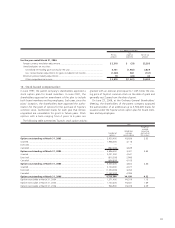
An analysis of the allowance for credit losses relating to finance receivables and vehicles and equipment on operating leases
for the years ended March 31, 2004, 2005 and 2006 is as follows:
U.S. dollars
Yen in millions in millions
For the year ended
For the years ended March 31, March 31,
2004 2005 2006 2006
Allowance for credit losses at beginning of year..................................... ¥116,888 ¥87,462 ¥91,829 $782
Provision for credit losses....................................................................... 66,598 47,402 52,285 445
Charge-offs, net of recoveries ................................................................ (92,835) (44,587) (50,324) (428)
Other .................................................................................................... (3,189) 1,552 7,593 64
Allowance for credit losses at end of year ...................................... ¥ 87,462 ¥91,829 ¥101,383 $863
The other amount primarily includes the impact of currency translation adjustments for the years ended March 31, 2004,
2005 and 2006.
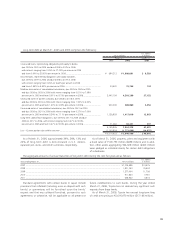
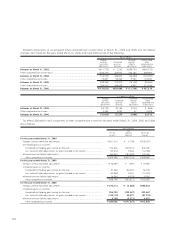
12. Affiliated companies and variable interest entities:
Investments in and transactions with affiliated companies—
Summarized financial information for affiliated companies accounted for by the equity method is shown below:
U.S. dollars
Yen in millions in millions
March 31, March 31,
2005 2006 2006
Current assets ............................................................................................................... ¥ 5,282,960 ¥6,259,683 $ 53,288
Noncurrent assets ......................................................................................................... 8,017,220 10,148,606 86,393
Total assets........................................................................................................... ¥13,300,180 ¥16,408,289 $139,681
Current liabilities ........................................................................................................... ¥ 3,982,816 ¥4,925,104 $ 41,927
Long-term liabilities....................................................................................................... 4,167,042 5,262,042 44,795
Shareholders’equity ..................................................................................................... 5,150,322 6,221,143 52,959
Total liabilities and shareholders’equity ................................................................ ¥13,300,180 ¥16,408,289 $139,681
Toyota’s share of shareholders’equity........................................................................... ¥ 1,556,236 ¥1,820,717 $ 15,499
Number of affiliated companies accounted for by the equity method at end of period... 56 56
U.S. dollars
Yen in millions in millions
For the year ended
For the years ended March 31, March 31,
2004 2005 2006 2006
Net revenues ......................................................................................... ¥13,187,869 ¥15,359,634 ¥18,332,304 $156,059
Gross profit ........................................................................................... ¥ 1,650,233 ¥ 1,900,344 ¥2,197,699 $ 18,709
Net income ........................................................................................... ¥ 403,213 ¥ 420,640 ¥559,686 $ 4,765
Entities comprising a significant portion of Toyota’s invest-
ment in affiliated companies include Denso Corporation; Aisin
Seiki Co., Ltd.; Toyota Industries Corporation; Toyota Tsusho
Corporation; and Toyota Boshoku Corporation.
Certain affiliated companies accounted for by the equity
method with carrying amounts of ¥1,235,535 million and
¥1,487,708 million ($12,665 million) at March 31, 2005 and
2006, respectively, were quoted on various established mar-
kets at an aggregate value of ¥1,827,725 million and
¥2,818,476 million ($23,993 million), respectively.