Toyota 2006 Annual Report Download - page 117
Download and view the complete annual report
Please find page 117 of the 2006 Toyota annual report below. You can navigate through the pages in the report by either clicking on the pages listed below, or by using the keyword search tool below to find specific information within the annual report.-
 1
1 -
2
-
3
-
4
-
5
-
6
-
7
-
8
-
9
-
10
-
11
-
12
-
13
-
14
-
15
-
16
-
17
-
18
-
19
-
20
-
21
-
22
-
23
-
24
-
25
-
26
-
27
-
28
-
29
-
30
-
31
-
32
-
33
-
34
-
35
-
36
-
37
-
38
-
39
-
40
-
41
-
42
-
43
-
44
-
45
-
46
-
47
-
48
-
49
-
50
-
51
-
52
-
53
-
54
-
55
-
56
-
57
-
58
-
59
-
60
-
61
-
62
-
63
-
64
-
65
-
66
-
67
-
68
-
69
-
70
-
71
-
72
-
73
-
74
-
75
-
76
-
77
-
78
-
79
-
80
-
81
-
82
-
83
-
84
-
85
-
86
-
87
-
88
-
89
-
90
-
91
-
92
-
93
-
94
-
95
-
96
-
97
-
98
-
99
-
100
-
101
-
102
-
103
-
104
-
105
-
106
-
 107
107 -
 108
108 -
 109
109 -
 110
110 -
 111
111 -
 112
112 -
 113
113 -
 114
114 -
 115
115 -
 116
116 -
 117
117 -
 118
118 -
 119
119 -
 120
120 -
 121
121 -
 122
122 -
 123
123 -
 124
124 -
 125
125 -
 126
126 -
 127
127 -
128
-
129
-
130
-
131
-
132
-
133
-
134
-
135
-
136
-
137
-
138
-
139
-
140
 |
 |

115
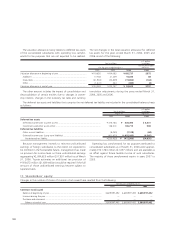
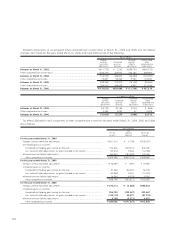
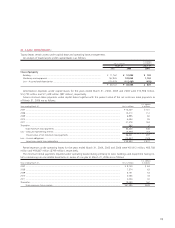
For plans where the accumulated benefit obligation net of
plan assets exceeds the accrued pension and severance costs,
Toyota has recorded a minimum pension liability. The mini-
mum pension liability amounts at March 31, 2005 and 2006
were ¥56,021 million and ¥43,980 million ($374 million),
respectively. Changes in the minimum pension liability are
reflected as adjustments in other comprehensive income for
the years ended March 31, 2004, 2005 and 2006 as follows:
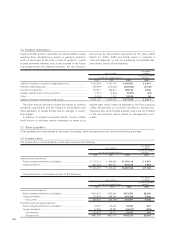
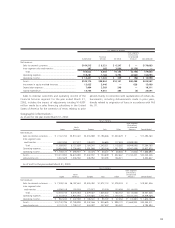
The projected benefit obligation, accumulated benefit obligation and fair value of plan assets for which the accumulated ben-
efit obligations exceed plan assets are as follows:
U.S.dollars
Yen in millions in millions
March 31, March 31,
2005 2006 2006
Projected benefit obligation .......................................................................................... ¥512,571 ¥535,482 $4,558
Accumulated benefit obligation .................................................................................... 489,975 511,668 4,356
Fair value of plan assets................................................................................................. 63,675 83,790 713
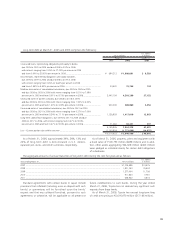
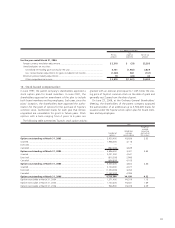
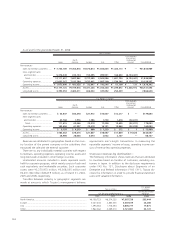
Components of the net periodic pension cost are as follows:
U.S. dollars
Yen in millions in millions
For the year ended
For the years ended March 31, March 31,
2004 2005 2006 2006
Service cost ........................................................................................... ¥ 75,988 ¥ 60,715 ¥ 64,582 $ 550
Interest cost .......................................................................................... 48,674 37,790 40,196 342
Expected return on plan assets .............................................................. (24,991) (27,517) (24,278) (207)
Amortization of prior service costs ......................................................... (15,092) (16,599) (17,037) (145)
Recognized net actuarial loss ................................................................. 45,653 22,366 19,489 166
Settlement loss resulting from the transfer
of the substitutional portion ................................................................ 213,830 74,344 ——
Amortization of net transition obligation ............................................... 18,963 9,981 1,944 17
Net periodic pension cost .................................................................. ¥363,025 ¥161,080 ¥ 84,896 $ 723
U.S. dollars
Yen in millions in millions
For the year ended
For the years ended March 31, March 31,
2004 2005 2006 2006
Minimum pension liability adjustments,
included in other comprehensive income ............................................. ¥273,265 ¥9,780 ¥4,937 $42
Weighted-average assumptions used to determine benefit obligations as of March 31, 2005 and 2006 are as follows:
March 31,
2005 2006
Discount rate .................................................................................................................................................. 2.6% 2.6%
Rate of compensation increase........................................................................................................................ 0.1–9.7% 0.1–11.0%