Toyota 2006 Annual Report Download - page 5
Download and view the complete annual report
Please find page 5 of the 2006 Toyota annual report below. You can navigate through the pages in the report by either clicking on the pages listed below, or by using the keyword search tool below to find specific information within the annual report.-
 1
1 -
 2
2 -
 3
3 -
 4
4 -
 5
5 -
 6
6 -
 7
7 -
 8
8 -
 9
9 -
 10
10 -
 11
11 -
 12
12 -
 13
13 -
 14
14 -
 15
15 -
 16
16 -
17
-
18
-
19
-
20
-
21
-
22
-
23
-
24
-
25
-
26
-
27
-
28
-
29
-
30
-
31
-
32
-
33
-
34
-
35
-
36
-
37
-
38
-
39
-
40
-
41
-
42
-
43
-
44
-
45
-
46
-
47
-
48
-
49
-
50
-
51
-
52
-
53
-
54
-
55
-
56
-
57
-
58
-
59
-
60
-
61
-
62
-
63
-
64
-
65
-
66
-
67
-
68
-
69
-
70
-
71
-
72
-
73
-
74
-
75
-
76
-
77
-
78
-
79
-
80
-
81
-
82
-
83
-
84
-
85
-
86
-
87
-
88
-
89
-
90
-
91
-
92
-
93
-
94
-
95
-
96
-
97
-
98
-
99
-
100
-
101
-
102
-
103
-
104
-
105
-
106
-
107
-
108
-
109
-
110
-
111
-
112
-
113
-
114
-
115
-
116
-
117
-
118
-
119
-
120
-
121
-
122
-
123
-
124
-
125
-
126
-
127
-
128
-
129
-
130
-
131
-
132
-
133
-
134
-
135
-
136
-
137
-
138
-
139
-
140
 |
 |
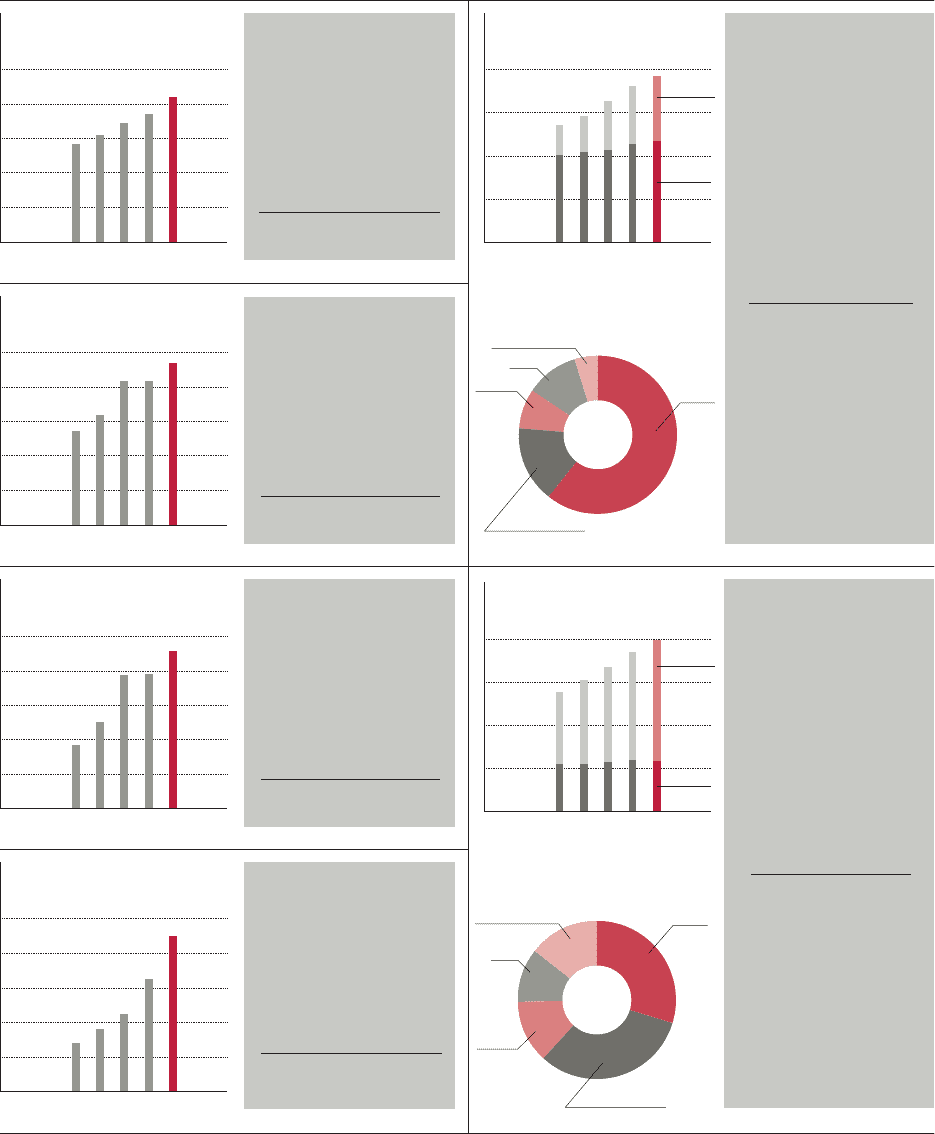
15,000
10,000
5,000
20,000
25,000
’02 ’03 ’04 ’05 ’06
0
4,000
2,000
6,000
8,000
’02 ’03 ’04 ’05 ’06
0
1,200
800
400
1,600
2,000
’02 ’03 ’04 ’05 ’06
0
900
600
300
1,200
1,500
’02 ’03 ’04 ’05 ’06
0
60
40
20
80
100
’02 ’03 ’04 ’05 ’06
0
4,000
2,000
6,000
8,000
’02 ’03 ’04 ’05 ’06
0
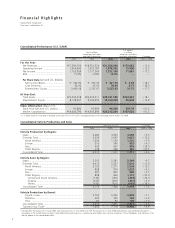
FY
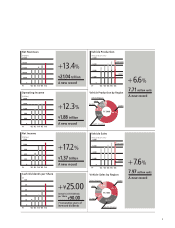
Net Revenues
(¥ Billion)
FY
Vehicle Production
Vehicle Production by Region
(Thousands of units)
+13.4%
A new record
¥21.04 trillion
FY
Operating Income
(¥ Billion)
+12.3%
A new record
¥1.88 trillion
FY
Net Income
(¥ Billion)
+17.2%
A new record
¥1. 37 trillion
FY
Cash Dividends per Share
(¥)
+¥25.00
7 consecutive years of
increased dividends
¥90.00
FY 2006
10.8%
4.8%
8.1%
15.6%
60.7%
FY
Vehicle Sales
Vehicle Sales by Region
(Thousands of units)
FY 2006
11.0%
14.4%
12.8%
32.1%
29.7%
Annual Cash Dividends
per Share
+6.6%
A new record
7.71 million units
+7.6 %
A new record
7.97 million units
Japan
North America
Europe
Asia
Other Regions
Japan
North America
Europe
Asia
Other Regions
Japan
Overseas
Japan
Overseas
3