Toyota 2006 Annual Report Download - page 96
Download and view the complete annual report
Please find page 96 of the 2006 Toyota annual report below. You can navigate through the pages in the report by either clicking on the pages listed below, or by using the keyword search tool below to find specific information within the annual report.-
 1
1 -
2
-
3
-
4
-
5
-
6
-
7
-
8
-
9
-
10
-
11
-
12
-
13
-
14
-
15
-
16
-
17
-
18
-
19
-
20
-
21
-
22
-
23
-
24
-
25
-
26
-
27
-
28
-
29
-
30
-
31
-
32
-
33
-
34
-
35
-
36
-
37
-
38
-
39
-
40
-
41
-
42
-
43
-
44
-
45
-
46
-
47
-
48
-
49
-
50
-
51
-
52
-
53
-
54
-
55
-
56
-
57
-
58
-
59
-
60
-
61
-
62
-
63
-
64
-
65
-
66
-
67
-
68
-
69
-
70
-
71
-
72
-
73
-
74
-
75
-
76
-
77
-
78
-
79
-
80
-
81
-
82
-
83
-
84
-
85
-
 86
86 -
 87
87 -
 88
88 -
 89
89 -
 90
90 -
 91
91 -
 92
92 -
 93
93 -
 94
94 -
 95
95 -
 96
96 -
 97
97 -
 98
98 -
 99
99 -
 100
100 -
 101
101 -
 102
102 -
 103
103 -
 104
104 -
 105
105 -
 106
106 -
107
-
108
-
109
-
110
-
111
-
112
-
113
-
114
-
115
-
116
-
117
-
118
-
119
-
120
-
121
-
122
-
123
-
124
-
125
-
126
-
127
-
128
-
129
-
130
-
131
-
132
-
133
-
134
-
135
-
136
-
137
-
138
-
139
-
140
 |
 |

94
rates. Toyota does not use derivatives for speculation or trad-
ing purposes. Changes in the fair value of derivatives are
recorded each period in current earnings or through other
comprehensive income, depending on whether a derivative is
designated as part of a hedge transaction and the type of
hedge transaction. The ineffective portion of all hedges is rec-
ognized currently in operations.
Net income per share—
Basic net income per common share is calculated by dividing
net income by the weighted-average number of shares out-
standing during the reported period. The calculation of dilut-
ed net income per common share is similar to the calculation
of basic net income per share, except that the weighted-aver-
age number of shares outstanding includes the additional
dilution from the assumed exercise of dilutive stock options.
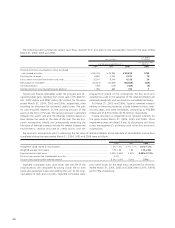
Stock-based compensation—
Toyota measures compensation expense for its stock-based
compensation plan using the intrinsic value method. Toyota
accounts for the stock-based compensation plans under the
recognition and measurement principles of the Accounting
Principles Board (“APB”) Opinion No. 25 (“APB25”),
Accounting for Stock Issued to Employees, and related
Interpretations. No stock-based compensation cost is reflected
in net income, as all options granted under those plans had
an exercise price higher than the market value of the underly-
ing common stock on the date of grant. The following table
illustrates the effect on net income and earnings per share if
the company had applied the fair value recognition provisions
of FAS No. 123, Accounting for Stock-Based Compensation
(“FAS 123”), to stock-based employee compensation. See
note 18 to the consolidated financial statements for weight-
ed-average assumptions used in option pricing model.
U.S. dollars
Yen in millions in millions
For the year ended
For the years ended March 31, March 31,
2004 2005 2006 2006
Net income
As reported ....................................................................................... ¥1,162,098 ¥1,171,260 ¥1,372,180 $11,681
Deduct: Total stock-based compensation expenses
determined under fair value based method
for all awards, net of related tax effects ....................................... (1,292) (1,571) (1,449) (12)
Pro forma.......................................................................................... ¥1,160,806 ¥1,169,689 ¥1,370,731 $11,669
Net income per share
—Basic As reported............................................................. ¥342.90 ¥355.35 ¥421.76 $3.59
Pro forma................................................................ 342.51 354.87 421.32 3.59
—Diluted As reported............................................................. ¥342.86 ¥355.28 ¥421.62 $3.59
Pro forma................................................................ 342.48 354.80 421.18 3.59
Other comprehensive income—
Other comprehensive income refers to revenues, expenses,
gains and losses that, under accounting principles generally
accepted in the United States of America are included in com-
prehensive income, but are excluded from net income as these
amounts are recorded directly as an adjustment to sharehold-
ers’ equity. Toyota’s other comprehensive income is primarily
comprised of unrealized gains/losses on marketable securities
designated as available-for-sale, foreign currency translation
adjustments, gains/losses on certain derivative instruments
and adjustments attributed to additional minimum pension
liabilities associated with Toyota’s defined benefit pension
plans.