Toyota 2006 Annual Report Download - page 72
Download and view the complete annual report
Please find page 72 of the 2006 Toyota annual report below. You can navigate through the pages in the report by either clicking on the pages listed below, or by using the keyword search tool below to find specific information within the annual report.-
 1
1 -
2
-
3
-
4
-
5
-
6
-
7
-
8
-
9
-
10
-
11
-
12
-
13
-
14
-
15
-
16
-
17
-
18
-
19
-
20
-
21
-
22
-
23
-
24
-
25
-
26
-
27
-
28
-
29
-
30
-
31
-
32
-
33
-
34
-
35
-
36
-
37
-
38
-
39
-
40
-
41
-
42
-
43
-
44
-
45
-
46
-
47
-
48
-
49
-
50
-
51
-
52
-
53
-
54
-
55
-
56
-
57
-
58
-
59
-
60
-
61
-
 62
62 -
 63
63 -
 64
64 -
 65
65 -
 66
66 -
 67
67 -
 68
68 -
 69
69 -
 70
70 -
 71
71 -
 72
72 -
 73
73 -
 74
74 -
 75
75 -
 76
76 -
 77
77 -
 78
78 -
 79
79 -
 80
80 -
 81
81 -
 82
82 -
83
-
84
-
85
-
86
-
87
-
88
-
89
-
90
-
91
-
92
-
93
-
94
-
95
-
96
-
97
-
98
-
99
-
100
-
101
-
102
-
103
-
104
-
105
-
106
-
107
-
108
-
109
-
110
-
111
-
112
-
113
-
114
-
115
-
116
-
117
-
118
-
119
-
120
-
121
-
122
-
123
-
124
-
125
-
126
-
127
-
128
-
129
-
130
-
131
-
132
-
133
-
134
-
135
-
136
-
137
-
138
-
139
-
140
 |
 |
70
exchange of marketable equity investments related shares of
UFJ Holdings, Inc. held by a domestic consolidated subsidiary
prior to the merger with Mitsubishi Tokyo Financial Group, Inc.
resulting in the receipt of new shares in the post-merger entity.
Equity in earnings of affiliated companies during fiscal 2006
increased by ¥24.9 billion, or 17.8%, to ¥164.3 billion com-
pared with the prior year due to an increase in net income
attributable to favorable operations at the affiliated companies.
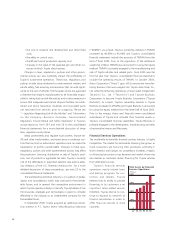
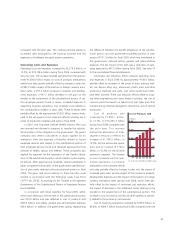
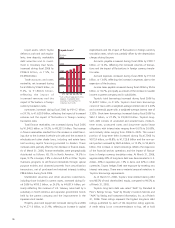
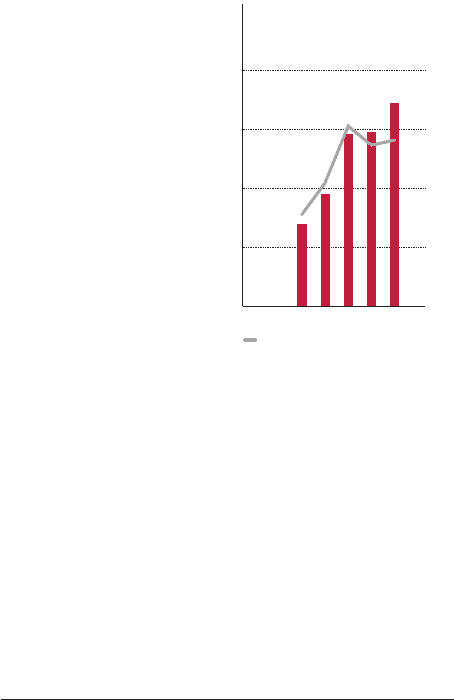
Net Income
Toyota’s net income increased
by ¥200.9 billion, or 17.2%,
to ¥1,372.1 billion during fiscal
2006 compared with the
prior year.
Other Comprehensive
Income and Loss
Other comprehensive income
increased by ¥394.0 billion, or
4.2 times, to ¥517.9 billion for
fiscal 2006 compared with the
prior year. This increase resulted
primarily from an increase in
unrealized holding gains on
securities during fiscal 2006 of ¥244.6 billion compared with
unrealized holding gains of ¥38.4 billion in the prior year
reflecting the improvement in the Japanese stock market and
foreign currency translation adjustment gains of ¥268.4 billion
in fiscal 2006 compared with gains of ¥75.7 billion in the prior
year. These increases in other comprehensive income were par-
tially offset by the lower gain adjustment in the minimum pen-
sion liability component during fiscal 2006 of ¥4.9 billion
compared to a ¥9.8 billion gain adjustment in the prior year.
Results of Operations—Fiscal 2005 Compared
with Fiscal 2004
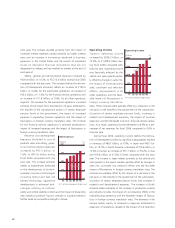
Net Revenues
Toyota had net revenues for fiscal 2005 of ¥18,551.5 billion, an
increase of ¥1,256.8 billion, or 7.3%, compared with the prior
year. This increase principally reflects the impact of increased
vehicle unit sales, increased parts and service sales and
increased financings. These increases were partially offset by the
impact of fluctuations in foreign currency translation rates par-
ticularly against the U.S. dollar. Eliminating the difference in the
yen value used for translation purposes, net revenues would
have been approximately ¥18,846.1 billion during fiscal 2005, a
9.0% increase compared with the prior year. Toyota’s net
revenues include net revenues from sales of products that
increased during fiscal 2005 by 7.3% from the prior year to
¥17,790.8 billion and net revenues from financing operations
that increased 6.1% in fiscal 2005 compared with the prior year
to ¥760.7 billion. Eliminating the difference in the yen value
used for translation purposes, net revenues from sales of prod-
ucts would have been approximately ¥18,062.8 billion, a 9.0%
increase, while net revenues from financing operations would
have increased approximately 9.3% during fiscal 2005 com-
pared to the prior year to ¥783.3 billion. Geographically, net
revenues for fiscal 2005 increased by 3.4% in Japan, 4.7% in
North America, 14.2% in Europe, 31.4% in Asia and 7.7% in
Other compared with the prior year. Eliminating the difference
in the yen value used for translation purposes, net revenues in
fiscal 2005 would have increased by 3.4% in Japan, 10.0% in
North America, 12.2% in Europe, 34.9% in Asia and 5.5% in
Other compared with the prior year.
The following is a discussion of net revenues for each of
Toyota’s business segments. The net revenue amounts
discussed are amounts before the elimination of intersegment
revenues.
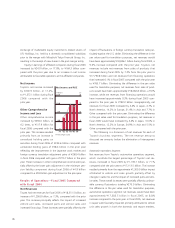
Automotive Operations Segment
Net revenues from Toyota’s automotive operations segment,
which constitute the largest percentage of Toyota’s net rev-
enues, increased in fiscal 2005 by ¥1,139.7 billion, or 7.1%
compared with the prior year to ¥17,113.5 billion. The increase
resulted primarily from the approximate ¥1,300.0 billion impact
attributed to vehicle unit sales growth partially offset by
changes in sales mix and the impact of increased parts and serv-
ice sales. These overall increases were partially offset by unfavor-
able currency fluctuations totaling ¥270.0 billion. Eliminating
the difference in the yen value used for translation purposes,
automotive operations segment net revenues would have been
approximately ¥17,383.5 billion in fiscal 2005, an 8.8%
increase compared to the prior year. In fiscal 2005, net revenues
in Japan were favorably impacted primarily attributed to vehicle
unit sales growth in both the domestic and export markets,
800
400
1,200
1,600
’02 ’03 ’04 ’05 ’06
0
10
5
15
20
0
Net Income and ROE
(¥ Billion) (%)
ROE (Right scale)
FY