Toyota 2006 Annual Report Download - page 71
Download and view the complete annual report
Please find page 71 of the 2006 Toyota annual report below. You can navigate through the pages in the report by either clicking on the pages listed below, or by using the keyword search tool below to find specific information within the annual report.-
 1
1 -
2
-
3
-
4
-
5
-
6
-
7
-
8
-
9
-
10
-
11
-
12
-
13
-
14
-
15
-
16
-
17
-
18
-
19
-
20
-
21
-
22
-
23
-
24
-
25
-
26
-
27
-
28
-
29
-
30
-
31
-
32
-
33
-
34
-
35
-
36
-
37
-
38
-
39
-
40
-
41
-
42
-
43
-
44
-
45
-
46
-
47
-
48
-
49
-
50
-
51
-
52
-
53
-
54
-
55
-
56
-
57
-
58
-
59
-
60
-
 61
61 -
 62
62 -
 63
63 -
 64
64 -
 65
65 -
 66
66 -
 67
67 -
 68
68 -
 69
69 -
 70
70 -
 71
71 -
 72
72 -
 73
73 -
 74
74 -
 75
75 -
 76
76 -
 77
77 -
 78
78 -
 79
79 -
 80
80 -
 81
81 -
82
-
83
-
84
-
85
-
86
-
87
-
88
-
89
-
90
-
91
-
92
-
93
-
94
-
95
-
96
-
97
-
98
-
99
-
100
-
101
-
102
-
103
-
104
-
105
-
106
-
107
-
108
-
109
-
110
-
111
-
112
-
113
-
114
-
115
-
116
-
117
-
118
-
119
-
120
-
121
-
122
-
123
-
124
-
125
-
126
-
127
-
128
-
129
-
130
-
131
-
132
-
133
-
134
-
135
-
136
-
137
-
138
-
139
-
140
 |
 |
69
efforts in the manufacturing operations, an increase in produc-
tion volume and vehicle unit sales and the favorable impact of
fluctuations in foreign currency translation rates. The increase in
Asia relates primarily to the increase in production volume and
vehicle unit sales due to the IMV series. The increase in Other
relates primarily to the impact of the increase in production vol-
ume and vehicle unit sales mainly attributed to the IMV series.
The following is a discussion of operating income for each
of Toyota’s business segments. The operating income amounts
discussed are before the elimination of intersegment profits.
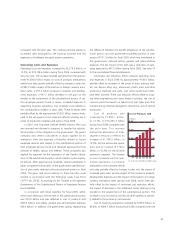
Automotive Operations Segment
Operating income from Toyota’s automotive operations
increased by ¥241.5 billion, or 16.6%, to ¥1,694.0 billion dur-
ing fiscal 2006 compared with the prior year. This increase is
primarily attributed to the increase in vehicle unit sales, the
increase in parts sales and the impact of continued cost reduc-
tion efforts and the favorable impact of fluctuations in foreign
currency translation rates. This increase was partially offset by a
reduction in the net gains on the transfer to the government of
the substitutional portion of certain employee pension funds,
the increase in research and development expenses and the
increase in expenses corresponding to business expansion.
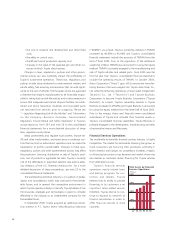
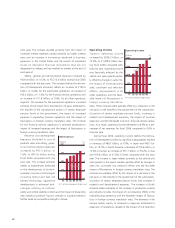
Financial Services Operations Segment
Operating income from Toyota’s financial services operations
decreased by ¥45.0 billion, or 22.4%, to ¥155.8 billion during
fiscal 2006 compared with the prior year. This decrease was pri-
marily due to the impact of unrealized losses on derivative
financial instruments such as interest rate swap and the impact
of adjustments made by a sales financing subsidiary in fiscal
2005 for the correction of errors relating to prior periods (see
note 24 to the consolidated financial statements), despite of the
increase in the finance receivables asset base and the favorable
impact of fluctuations in foreign currency translation rates.
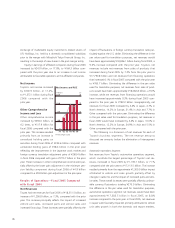
All Other Operations Segment
Operating income from Toyota’s other businesses increased by
¥6.0 billion, or 17.8%, to ¥39.7 billion during fiscal 2006 com-
pared with the prior year. This increase primarily relates to
increased production volume and sales attributed to the hous-
ing business and the expansion of intelligent transport systems
operations.
Other Income and Expenses
Interest and dividend income increased by ¥26.5 billion, or
39.2%, to ¥94.0 billion during fiscal 2006 compared with the
prior year mainly due to an increase in investment securities
held by the United States subsidiaries.
Interest expense increased by ¥2.7 billion, or 14.0%, to
¥21.6 billion during fiscal 2006 compared with the prior year
due to an increase in borrowings in the automotive operations
segment.
Foreign exchange gains, net decreased by ¥10.6 billion, or
49.6%, to ¥10.8 billion during fiscal 2006 compared with the
prior year. Foreign exchange gains and losses include the differ-
ences between the value of foreign currency denominated sales
translated at prevailing exchange rates and the value of the
sales amounts settled during the year, including those settled
using forward foreign currency exchange contracts.
Other income, net increased by ¥113.4 billion, or 10.1
times, to ¥125.8 billion during fiscal 2006. This increase prima-
rily relates to the gain of ¥143.3 billion yen for a nonmonetary
exchange of marketable equity securities. The gain was calculat-
ed in accordance with EITF No. 91-5 “Nonmonetary Exchange
of Cost-Method Investments”, which was determined as the dif-
ference between acquisition costs of pre-merger UFJ Holdings,
Inc. shares that Toyota had held and the fair market value of
post-merger Mitsubishi UFJ Financial Group, Inc. shares that
Toyota received in exchange for shares of UFJ Holdings, Inc. fol-
lowing the merger between Mitsubishi Tokyo Financial Group,
Inc. and UFJ Holdings, Inc.
Income Taxes
The provision for income taxes increased ¥137.2 billion, or
20.9%, to ¥795.1 billion during fiscal 2006 compared with the
prior year primarily due to the increase in income before income
taxes. The effective tax rate for fiscal 2006 was relatively
unchanged compared to the rate for fiscal 2005.
Minority Interest in Consolidated Subsidiaries and
Equity in Earnings of Affiliated Companies
Minority interest in consolidated subsidiaries increased by ¥19.5
billion, or 30.0%, to ¥84.4 billion during fiscal 2006 compared
with the prior year. This increase was mainly due to favorable
operating results at consolidated subsidiaries and a gain calcu-
lated in accordance with EITF 91-5 from the nonmonetary