Toyota 2006 Annual Report Download - page 70
Download and view the complete annual report
Please find page 70 of the 2006 Toyota annual report below. You can navigate through the pages in the report by either clicking on the pages listed below, or by using the keyword search tool below to find specific information within the annual report.-
 1
1 -
2
-
3
-
4
-
5
-
6
-
7
-
8
-
9
-
10
-
11
-
12
-
13
-
14
-
15
-
16
-
17
-
18
-
19
-
20
-
21
-
22
-
23
-
24
-
25
-
26
-
27
-
28
-
29
-
30
-
31
-
32
-
33
-
34
-
35
-
36
-
37
-
38
-
39
-
40
-
41
-
42
-
43
-
44
-
45
-
46
-
47
-
48
-
49
-
50
-
51
-
52
-
53
-
54
-
55
-
56
-
57
-
58
-
59
-
 60
60 -
 61
61 -
 62
62 -
 63
63 -
 64
64 -
 65
65 -
 66
66 -
 67
67 -
 68
68 -
 69
69 -
 70
70 -
 71
71 -
 72
72 -
 73
73 -
 74
74 -
 75
75 -
 76
76 -
 77
77 -
 78
78 -
 79
79 -
 80
80 -
81
-
82
-
83
-
84
-
85
-
86
-
87
-
88
-
89
-
90
-
91
-
92
-
93
-
94
-
95
-
96
-
97
-
98
-
99
-
100
-
101
-
102
-
103
-
104
-
105
-
106
-
107
-
108
-
109
-
110
-
111
-
112
-
113
-
114
-
115
-
116
-
117
-
118
-
119
-
120
-
121
-
122
-
123
-
124
-
125
-
126
-
127
-
128
-
129
-
130
-
131
-
132
-
133
-
134
-
135
-
136
-
137
-
138
-
139
-
140
 |
 |
68
prior year. The increase resulted primarily from the impact of
increased interest expenses caused primarily by higher interest
rates and an increase in borrowings attributed to business
expansion in the United States and the impact of unrealized
losses on derivative financial instruments that are not
designated as hedges and are marked-to-market at the end of
each period.
Selling, general and administrative expenses increased by
¥204.4 billion, or 10.2%, to ¥2,213.6 billion during fiscal 2006
compared with the prior year. This increase (before the elimina-
tion of intersegment amounts) reflects an increase of ¥192.6
billion, or 10.6%, for the automotive operations, an increase of
¥23.2 billion, or 11.4%, for the financial services operations and
an increase of ¥11.8 billion, or 9.6%, for all other operations
segment. The increase for the automotive operations consisted
primarily of the impact from the reduction of gains attributed to
the transfer of the substitutional portion of certain employee
pension funds to the government, the impact of increased
expenses in expanding business operations and the impact of
fluctuations in foreign currency translation rates. The increase
for the financial services operations is primarily attributed to
impact of increased expenses and the impact of fluctuations in
foreign currency translation rates.
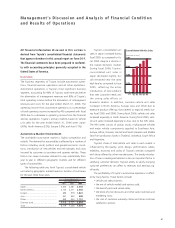
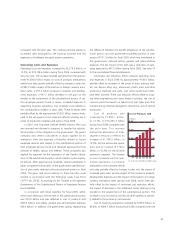
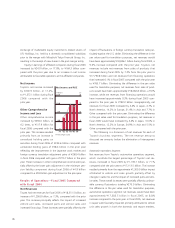
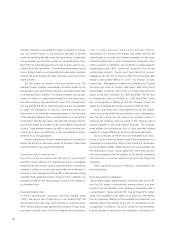
Research and development
expenses (included in cost of
products sales and selling, gener-
al and administrative expenses)
increased by ¥57.5 billion, or
7.6%, to ¥812.6 billion during
fiscal 2006 compared with the
prior year. This increase primarily
relates to expenditures attributed
to the development of environ-
mentally conscious technologies
including hybrid and fuel cell
battery technology, aggressive
developments in advanced tech-
nologies relating to collision
safety and vehicle stability controls and the impact of expanding
new models to promote Toyota’s strength in a global market to
further build up competitive strength in future.
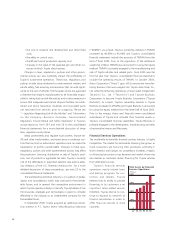
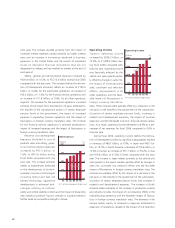
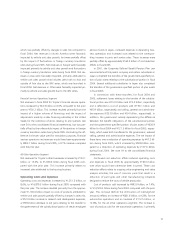
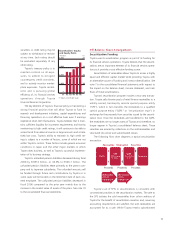
Operating Income
Toyota’s operating income
increased by ¥206.2 billion, or
12.3%, to ¥1,878.3 billion dur-
ing fiscal 2006 compared with
the prior year. Operating income
was favorably affected by the
vehicle unit sales growth partial-
ly offset by changes in sales mix,
the impact of increased parts
sales, continued cost reduction
efforts, improvements in all
other operations and the favor-
able impact of fluctuations in
foreign currency translation
rates. These increases were partially offset by a reduction in the
net gains on the transfer to the government of the substitution-
al portion of certain employee pension funds, increases in
research and development expenses, the impact of business
expansion and the decreased income in financial services opera-
tions. As a result, operating income decreased to 8.9% as a per-
centage of net revenues for fiscal 2006 compared to 9.0% in
the prior year.
During fiscal 2006, operating income (before the elimina-
tion of intersegment profits) by significant geographies resulted
in increases of ¥88.7 billion, or 9.0%, in Japan and ¥48.1 bil-
lion, or 10.7%, in North America, a decrease of ¥14.6 billion, or
13.4% in Europe, an increase of ¥51.7 billion, or 55.2%, in Asia
and ¥19.8 billion, or 41.6% in Other compared with the prior
year. The increase in Japan relates primarily to the vehicle unit
sales growth in the export markets partially offset by changes in
sales mix, continued cost reduction efforts and the favorable
impact of fluctuations in foreign currency translation rates. The
increase was partially offset by the impact of a decrease in the
net gains on the transfer to the government of the substitution-
al portion of certain employee pension funds and increases in
research and development expenses. The increase in North
America relates primarily to the increase in production volume
and vehicle unit sales, the impact of cost reduction efforts in the
manufacturing operations and the favorable impact of fluctua-
tions in foreign currency translation rates. The decrease in the
Europe relates mainly to increases in expenses attributed to
expansion of operations, despite of the impact of cost reduction
500
750
1,000
’02 ’03 ’04 ’05 ’06
0
6
250 3
9
12
0
R&D Expenses
(¥ Billion) (%)
% of sales of products (Right scale)
FY
1,000
500
1,500
2,000
’02 ’03 ’04 ’05 ’06
0
6
3
9
12
0
Operating Income
(¥ Billion) (%)
% of net revenues (Right scale)
FY