Toyota 2006 Annual Report Download - page 129
Download and view the complete annual report
Please find page 129 of the 2006 Toyota annual report below. You can navigate through the pages in the report by either clicking on the pages listed below, or by using the keyword search tool below to find specific information within the annual report.-
 1
1 -
2
-
3
-
4
-
5
-
6
-
7
-
8
-
9
-
10
-
11
-
12
-
13
-
14
-
15
-
16
-
17
-
18
-
19
-
20
-
21
-
22
-
23
-
24
-
25
-
26
-
27
-
28
-
29
-
30
-
31
-
32
-
33
-
34
-
35
-
36
-
37
-
38
-
39
-
40
-
41
-
42
-
43
-
44
-
45
-
46
-
47
-
48
-
49
-
50
-
51
-
52
-
53
-
54
-
55
-
56
-
57
-
58
-
59
-
60
-
61
-
62
-
63
-
64
-
65
-
66
-
67
-
68
-
69
-
70
-
71
-
72
-
73
-
74
-
75
-
76
-
77
-
78
-
79
-
80
-
81
-
82
-
83
-
84
-
85
-
86
-
87
-
88
-
89
-
90
-
91
-
92
-
93
-
94
-
95
-
96
-
97
-
98
-
99
-
100
-
101
-
102
-
103
-
104
-
105
-
106
-
107
-
108
-
109
-
110
-
111
-
112
-
113
-
114
-
115
-
116
-
117
-
118
-
 119
119 -
 120
120 -
 121
121 -
 122
122 -
 123
123 -
 124
124 -
 125
125 -
 126
126 -
 127
127 -
 128
128 -
 129
129 -
 130
130 -
 131
131 -
 132
132 -
 133
133 -
 134
134 -
 135
135 -
 136
136 -
 137
137 -
 138
138 -
 139
139 -
140
 |
 |

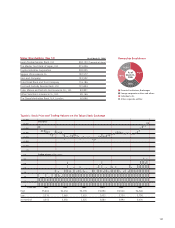
127
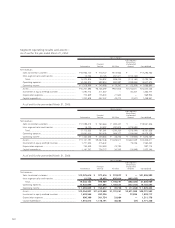
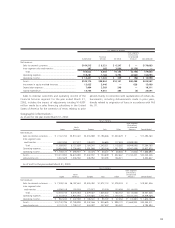
Statements of income—
U.S. dollars
Yen in millions in millions
For the year ended
For the years ended March 31, March 31,
2004 2005 2006 2006
Non-Financial Services Businesses
Net revenues ..................................................................................... ¥16,586,814 ¥17,800,357 ¥20,068,284 $170,838
Costs and expenses
Cost of revenues............................................................................ 13,507,835 14,497,252 16,335,340 139,060
Selling, general and administrative................................................. 1,540,724 1,813,288 1,993,528 16,971
Total costs and expenses ........................................................... 15,048,559 16,310,540 18,328,868 156,031
Operating income ............................................................................. 1,538,255 1,489,817 1,739,416 14,807
Other income, net ............................................................................. 97,885 68,736 201,978 1,720
Income before income taxes, minority interest
and equity in earnings of affiliated companies ................................. 1,636,140 1,558,553 1,941,394 16,527
Provision for income taxes ................................................................. 627,038 578,709 736,909 6,273
Income before minority interest and equity
in earnings of affiliated companies .................................................. 1,009,102 979,844 1,204,485 10,254
Minority interest in consolidated subsidiaries ..................................... (41,886) (63,952) (82,401) (702)
Equity in earnings of affiliated companies .......................................... 107,542 131,849 142,139 1,210
Net income–Non-Financial Services Businesses ................................... 1,074,758 1,047,741 1,264,223 10,762
Financial Services Businesses
Net revenues ..................................................................................... 736,852 781,261 996,909 8,487
Costs and expenses
Cost of revenues............................................................................ 365,750 376,150 613,563 5,223
Selling, general and administrative................................................. 225,104 204,258 227,529 1,937
Total costs and expenses ........................................................... 590,854 580,408 841,092 7,160
Operating income ............................................................................. 145,998 200,853 155,817 1,327
Other expense, net ............................................................................ (16,438) (4,764) (9,859) (84)
Income before income taxes, minority interest
and equity in earnings of affiliated companies ................................. 129,560 196,089 145,958 1,243
Provision for income taxes ................................................................. 53,959 78,748 58,241 496
Income before minority interest and equity
in earnings of affiliated companies .................................................. 75,601 117,341 87,717 747
Minority interest in consolidated subsidiaries ..................................... (815) (988) (1,992) (17)
Equity in earnings of affiliated companies .......................................... 12,753 7,622 22,227 189
Net income–Financial Services Businesses........................................... 87,539 123,975 107,952 919
Eliminations ...................................................................................... (199) (456) 50
Net income ....................................................................................... ¥ 1,162,098 ¥ 1,171,260 ¥1,372,180 $ 11,681