Toyota 2006 Annual Report Download - page 77
Download and view the complete annual report
Please find page 77 of the 2006 Toyota annual report below. You can navigate through the pages in the report by either clicking on the pages listed below, or by using the keyword search tool below to find specific information within the annual report.-
 1
1 -
2
-
3
-
4
-
5
-
6
-
7
-
8
-
9
-
10
-
11
-
12
-
13
-
14
-
15
-
16
-
17
-
18
-
19
-
20
-
21
-
22
-
23
-
24
-
25
-
26
-
27
-
28
-
29
-
30
-
31
-
32
-
33
-
34
-
35
-
36
-
37
-
38
-
39
-
40
-
41
-
42
-
43
-
44
-
45
-
46
-
47
-
48
-
49
-
50
-
51
-
52
-
53
-
54
-
55
-
56
-
57
-
58
-
59
-
60
-
61
-
62
-
63
-
64
-
65
-
66
-
 67
67 -
 68
68 -
 69
69 -
 70
70 -
 71
71 -
 72
72 -
 73
73 -
 74
74 -
 75
75 -
 76
76 -
 77
77 -
 78
78 -
 79
79 -
 80
80 -
 81
81 -
 82
82 -
 83
83 -
 84
84 -
 85
85 -
 86
86 -
 87
87 -
88
-
89
-
90
-
91
-
92
-
93
-
94
-
95
-
96
-
97
-
98
-
99
-
100
-
101
-
102
-
103
-
104
-
105
-
106
-
107
-
108
-
109
-
110
-
111
-
112
-
113
-
114
-
115
-
116
-
117
-
118
-
119
-
120
-
121
-
122
-
123
-
124
-
125
-
126
-
127
-
128
-
129
-
130
-
131
-
132
-
133
-
134
-
135
-
136
-
137
-
138
-
139
-
140
 |
 |
75
Toyota funds its financing programs for customers and
dealers, including loans and leasing programs, from both oper-
ating cash flows and borrowings by its finance subsidiaries.
Toyota seeks to expand its ability to raise funds locally in mar-
kets throughout the world by expanding its network of finance
subsidiaries.
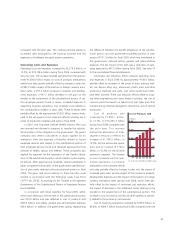
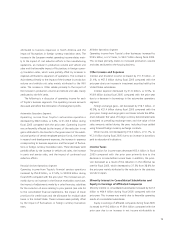
Net cash provided by
operating activities was
¥2,515.4 billion for fiscal
2006, compared with
¥2,370.9 billion for the
prior year. The increase in
net cash provided by oper-
ating activities resulted pri-
marily from increased
operating cash flows
attributed to the increase
of net income.
Net cash used in
investing activities was
¥3,375.5 billion for fiscal
2006, compared with
¥3,061.1 billion for the
prior year. The increase in
net cash used in investing activities resulted primarily from the
increase in additions to finance receivables and the increase in
additions to fixed assets including equipment leased to others,
which was partially offset by an increase in the collection of
finance receivables.
Net cash provided by financing activities was ¥876.9 billion
for fiscal 2006, compared with ¥419.3 billion for the prior year.
The increase in net cash provided by financing activities resulted
primarily from an increase in short-term debt and a decrease in
repurchasing shares of common stock of Toyota Motor
Corporation.
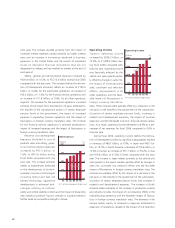
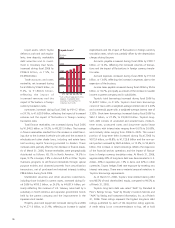
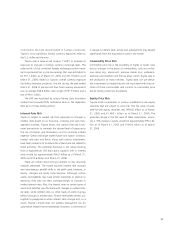
Total capital expenditures for property, plant and equip-
ment, excluding vehicles and equipment on operating leases,
were ¥1,523.4 billion during fiscal 2006, an increase of 42.6%
over the ¥1,068.2 billion in total capital expenditures for the
prior year. The increase in capital expenditures resulted primarily
from the impact of increased capital expenditures in domestic
subsidiaries and subsidiaries in North America for expansion of
production capability.
Total expenditures for vehicles
and equipment on operating
leases were ¥1,247.7 billion dur-
ing fiscal 2006, an increase of
45.9% over the ¥854.9 billion in
expenditures in the prior year. The
increase in expenditures for vehi-
cles and equipment on operating
leases resulted primarily from
increased operating lease assets
in finance subsidiaries in North
America and Europe.
Toyota expects investments in
property, plant and equipment,
excluding vehicles and equipment
on operating leases, to approxi-
mately ¥1,550.0 billion during fis-
cal 2007. Toyota’s expected capital expenditures include
approximately ¥850.0 billion in Japan, ¥330.0 billion in North
America, ¥130.0 billion in Europe, ¥135.0 billion in Asia and
¥105.0 billion in Other, respectively.
Based on currently available
information, Toyota does not
expect environmental matters to
have a material impact on its
financial position, results of oper-
ations, liquidity or cash flows dur-
ing fiscal 2007. However, there
exists a substantial amount of
uncertainty with respect to
Toyota’s obligations under current
and future environment regula-
tions as described in “Information
on the Company—Business
Overview—Governmental
Regulations, Environment and Safety Standards” in Toyota’s
annual report on Form 20-F.
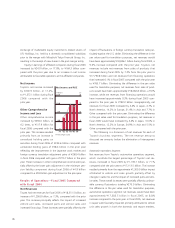
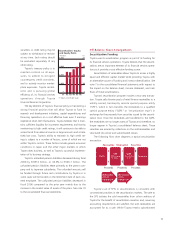
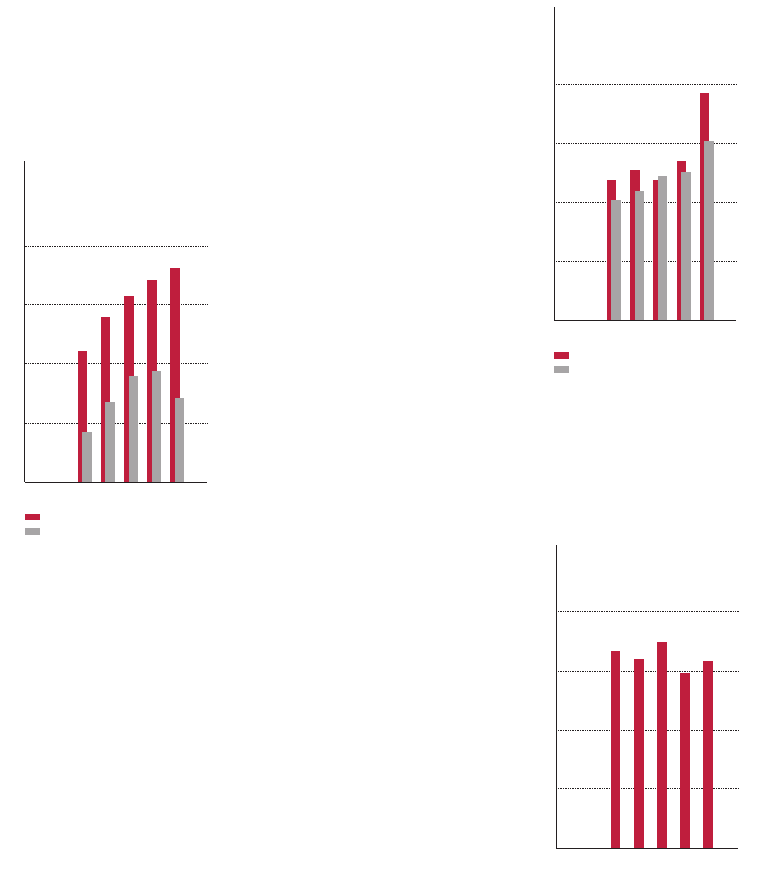
Cash and cash equivalents were ¥1,569.3 billion at March
31, 2006. Most of Toyota’s cash and cash equivalents are held
in Japanese yen and in U.S. dollars. In addition, time deposits
were ¥50.3 billion and marketable securities were ¥634.8 billion
at March 31, 2006.
1,400
700
2,100
2,800
’02 ’03 ’04 ’05 ’06
0
Net Cash Provided by
Operating Activities and
Free Cash Flow*
(¥ Billion)
Net cash provided by operating activities
FY
Free cash flow
* (Net cash provided by operating activities)
– (Capital expenditures for property, plant
and equipment, excluding vehicles and
equipment on operating leases)
800
400
1,200
1,600
’02 ’03 ’04 ’05 ’06
0
Capital Expenditures for
Property, Plant and Equip-
ment* and Depreciation
(¥ Billion)
Capital expenditures
FY
Depreciation
* Excluding vehicles and equipment
on operating leases
1,000
500
1,500
2,000
’02 ’03 ’04 ’05 ’06
0
Cash and Cash Equivalents
at End of Year
(¥ Billion)
FY