Toyota 2006 Annual Report Download - page 124
Download and view the complete annual report
Please find page 124 of the 2006 Toyota annual report below. You can navigate through the pages in the report by either clicking on the pages listed below, or by using the keyword search tool below to find specific information within the annual report.-
 1
1 -
2
-
3
-
4
-
5
-
6
-
7
-
8
-
9
-
10
-
11
-
12
-
13
-
14
-
15
-
16
-
17
-
18
-
19
-
20
-
21
-
22
-
23
-
24
-
25
-
26
-
27
-
28
-
29
-
30
-
31
-
32
-
33
-
34
-
35
-
36
-
37
-
38
-
39
-
40
-
41
-
42
-
43
-
44
-
45
-
46
-
47
-
48
-
49
-
50
-
51
-
52
-
53
-
54
-
55
-
56
-
57
-
58
-
59
-
60
-
61
-
62
-
63
-
64
-
65
-
66
-
67
-
68
-
69
-
70
-
71
-
72
-
73
-
74
-
75
-
76
-
77
-
78
-
79
-
80
-
81
-
82
-
83
-
84
-
85
-
86
-
87
-
88
-
89
-
90
-
91
-
92
-
93
-
94
-
95
-
96
-
97
-
98
-
99
-
100
-
101
-
102
-
103
-
104
-
105
-
106
-
107
-
108
-
109
-
110
-
111
-
112
-
113
-
 114
114 -
 115
115 -
 116
116 -
 117
117 -
 118
118 -
 119
119 -
 120
120 -
 121
121 -
 122
122 -
 123
123 -
 124
124 -
 125
125 -
 126
126 -
 127
127 -
 128
128 -
 129
129 -
 130
130 -
 131
131 -
 132
132 -
 133
133 -
 134
134 -
135
-
136
-
137
-
138
-
139
-
140
 |
 |

122
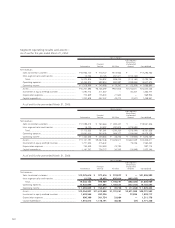
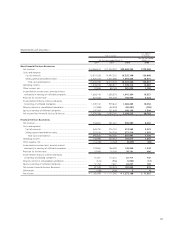
Segment operating results and assets—
As of and for the year ended March 31, 2004:
Yen in millions
Inter-segment
Elimination/
Financial Unallocated
Automotive Services All Other Amount Consolidated
Net revenues
Sales to external customers ............................................. ¥15,963,100 ¥ 716,727 ¥614,933 ¥ — ¥17,294,760
Inter-segment sales and transfers .................................... 10,726 20,125 281,311 (312,162) —
Total........................................................................... 15,973,826 736,852 896,244 (312,162) 17,294,760
Operating expenses......................................................... 14,454,872 590,854 880,997 (298,853) 15,627,870
Operating income ........................................................... ¥ 1,518,954 ¥ 145,998 ¥ 15,247 ¥ (13,309) ¥ 1,666,890
Assets ............................................................................. ¥10,207,395 ¥8,138,297 ¥941,925 ¥2,752,611 ¥22,040,228
Investment in equity method investees ............................ 1,092,713 211,657 — 60,407 1,364,777
Depreciation expenses..................................................... 772,829 175,533 21,542 — 969,904
Capital expenditure ......................................................... 1,020,608 432,222 43,212 (7,501) 1,488,541
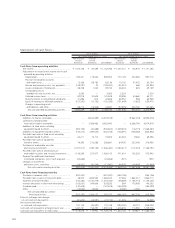
As of and for the year ended March 31, 2005:
Yen in millions
Inter-segment
Elimination/
Financial Unallocated
Automotive Services All Other Amount Consolidated
Net revenues
Sales to external customers ............................................. ¥17,098,415 ¥ 760,664 ¥ 692,447 ¥ — ¥18,551,526
Inter-segment sales and transfers .................................... 15,120 20,597 337,873 (373,590) —
Total........................................................................... 17,113,535 781,261 1,030,320 (373,590) 18,551,526
Operating expenses......................................................... 15,661,000 580,408 996,577 (358,646) 16,879,339
Operating income ........................................................... ¥ 1,452,535 ¥ 200,853 ¥ 33,743 ¥ (14,944) ¥ 1,672,187
Assets ............................................................................. ¥11,141,197 ¥9,487,248 ¥1,025,517 ¥2,681,049 ¥24,335,011
Investment in equity method investees ............................ 1,271,044 215,642 — 75,746 1,562,432
Depreciation expenses..................................................... 754,339 220,584 22,790 — 997,713
Capital expenditure ......................................................... 1,161,757 726,777 50,555 (15,849) 1,923,240
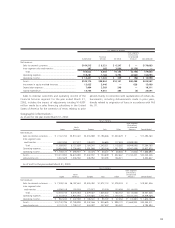
As of and for the year ended March 31, 2006:
Yen in millions
Inter-segment
Elimination/
Financial Unallocated
Automotive Services All Other Amount Consolidated
Net revenues
Sales to external customers ............................................. ¥19,325,616 ¥ 977,416 ¥ 733,877 ¥ — ¥21,036,909
Inter-segment sales and transfers .................................... 12,528 19,493 456,414 (488,435) —
Total........................................................................... 19,338,144 996,909 1,190,291 (488,435) 21,036,909
Operating expenses......................................................... 17,644,099 841,092 1,150,543 (477,167) 19,158,567
Operating income ........................................................... ¥1,694,045 ¥ 155,817 ¥ 39,748 ¥ (11,268) ¥ 1,878,342
Assets ............................................................................. ¥12,354,827 ¥11,613,508 ¥1,191,261 ¥3,571,999 ¥28,731,595
Investment in equity method investees ............................ 1,459,556 287,326 — 73,835 1,820,717
Depreciation expenses..................................................... 880,360 301,734 29,084 — 1,211,178
Capital expenditure ......................................................... 1,615,814 1,110,191 45,282 (47) 2,771,240