Toyota 2006 Annual Report Download - page 65
Download and view the complete annual report
Please find page 65 of the 2006 Toyota annual report below. You can navigate through the pages in the report by either clicking on the pages listed below, or by using the keyword search tool below to find specific information within the annual report.-
 1
1 -
2
-
3
-
4
-
5
-
6
-
7
-
8
-
9
-
10
-
11
-
12
-
13
-
14
-
15
-
16
-
17
-
18
-
19
-
20
-
21
-
22
-
23
-
24
-
25
-
26
-
27
-
28
-
29
-
30
-
31
-
32
-
33
-
34
-
35
-
36
-
37
-
38
-
39
-
40
-
41
-
42
-
43
-
44
-
45
-
46
-
47
-
48
-
49
-
50
-
51
-
52
-
53
-
54
-
 55
55 -
 56
56 -
 57
57 -
 58
58 -
 59
59 -
 60
60 -
 61
61 -
 62
62 -
 63
63 -
 64
64 -
 65
65 -
 66
66 -
 67
67 -
 68
68 -
 69
69 -
 70
70 -
 71
71 -
 72
72 -
 73
73 -
 74
74 -
 75
75 -
76
-
77
-
78
-
79
-
80
-
81
-
82
-
83
-
84
-
85
-
86
-
87
-
88
-
89
-
90
-
91
-
92
-
93
-
94
-
95
-
96
-
97
-
98
-
99
-
100
-
101
-
102
-
103
-
104
-
105
-
106
-
107
-
108
-
109
-
110
-
111
-
112
-
113
-
114
-
115
-
116
-
117
-
118
-
119
-
120
-
121
-
122
-
123
-
124
-
125
-
126
-
127
-
128
-
129
-
130
-
131
-
132
-
133
-
134
-
135
-
136
-
137
-
138
-
139
-
140
 |
 |
63
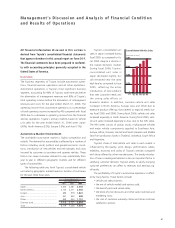
Toyota’s competitors for retail financing and retail leasing
include commercial banks, credit unions, and other finance
companies. Meanwhile, commercial banks and other captive
automobile finance companies also provide competition for
Toyota’s wholesale financing activities.
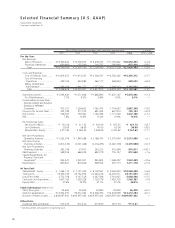
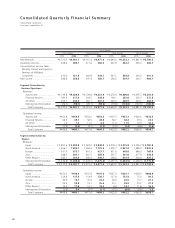
Toyota’s financial assets increased during fiscal 2006 result-
ing primarily from the continued expansion of its financial serv-
ices operations in North America.
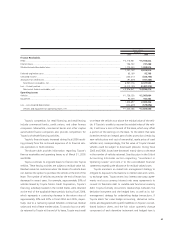
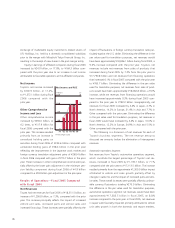
The above table provides information regarding Toyota’s
finance receivables and operating leases as of March 31, 2005
and 2006.
Toyota continues to originate leases to finance new Toyota
vehicles. These leasing activities are subject to residual value risk.
Residual value risk could arise when the lessee of a vehicle does
not exercise the option to purchase the vehicle at the end of the
lease. The number of vehicles returned at the end of leases has
decreased in recent years. For example, approximately 30% of
vehicles leased by Toyota Motor Credit Corporation, Toyota’s
financing subsidiary located in the United States, were returned
at the end of the applicable lease periods during fiscal 2006,
which represents a continuing decrease in the return rates of
approximately 50% and 40% in fiscal 2004 and 2005, respec-
tively, due to a narrowing spread between contractual residual
values and end of lease market values. To avoid a loss on a vehi-
cle returned to Toyota at the end of its lease, Toyota must resell
or re-lease the vehicle at or above the residual value of the vehi-
cle. If Toyota is unable to recover the residual value of the vehi-
cle, it will incur a loss at the end of the lease, which may offset
a portion of the earnings on the lease. To the extent that sales
incentives remain an integral part of sales promotions (reducing
new vehicle prices and cost of ownership), resale prices of used
vehicles and, correspondingly, the fair value of Toyota’s leased
vehicles could be subject to downward pressure. During fiscal
2005 and 2006, losses have decreased mainly due to a decrease
in the number of vehicles returned. See discussion in the Critical
Accounting Estimates section regarding “Investment in
Operating Leases” and note 2 to the consolidated financial
statements regarding the allowance for residual values losses.
Toyota maintains an overall risk management strategy to
mitigate its exposure to fluctuations in interest rates and curren-
cy exchange rates. Toyota enters into interest rate swap agree-
ments and cross currency interest rate swap agreements to
convert its fixed-rate debt to variable-rate functional currency
debt. Toyota formally documents relationships between the
derivative instrument and the hedged item, as well as its risk-
management strategy for undertaking hedge transactions. If
Toyota elects fair value hedge accounting, derivative instru-
ments are designated with specific liabilities on Toyota’s consoli-
dated balance sheet, and the fair value quarterly change
component of each derivative instrument and hedged item is
Yen in millions
March 31,
2005 2006
Finance Receivables
Retail ................................................................................................................................................................... ¥ 4,716,961 ¥ 5,930,822
Finance leases ...................................................................................................................................................... 756,732 741,280
Wholesale and other dealer loans ........................................................................................................................ 1,773,440 1,998,814
7,247,133 8,670,916
Deferred origination costs .................................................................................................................................... 65,189 92,798
Unearned income ................................................................................................................................................ (233,417) (334,796)
Allowance for credit losses................................................................................................................................... (91,829) (101,383)
Total finance receivables, net ........................................................................................................................... 6,987,076 8,327,535
Less – Current portion.......................................................................................................................................... (3,010,135) (3,497,319)
Noncurrent finance receivables, net ................................................................................................................. ¥ 3,976,941 ¥ 4,830,216
Operating Leases
Vehicles ............................................................................................................................................................... ¥ 1,736,238 ¥ 2,503,064
Equipment........................................................................................................................................................... 92,459 102,362
1,828,697 2,605,426
Less – Accumulated depreciation ......................................................................................................................... (424,609) (579,896)
Vehicles and equipment on operating leases, net ............................................................................................ ¥ 1,404,088 ¥ 2,025,530