Toyota 2006 Annual Report Download - page 17
Download and view the complete annual report
Please find page 17 of the 2006 Toyota annual report below. You can navigate through the pages in the report by either clicking on the pages listed below, or by using the keyword search tool below to find specific information within the annual report.-
 1
1 -
2
-
3
-
4
-
5
-
6
-
 7
7 -
 8
8 -
 9
9 -
 10
10 -
 11
11 -
 12
12 -
 13
13 -
 14
14 -
 15
15 -
 16
16 -
 17
17 -
 18
18 -
 19
19 -
 20
20 -
 21
21 -
 22
22 -
 23
23 -
 24
24 -
 25
25 -
 26
26 -
 27
27 -
28
-
29
-
30
-
31
-
32
-
33
-
34
-
35
-
36
-
37
-
38
-
39
-
40
-
41
-
42
-
43
-
44
-
45
-
46
-
47
-
48
-
49
-
50
-
51
-
52
-
53
-
54
-
55
-
56
-
57
-
58
-
59
-
60
-
61
-
62
-
63
-
64
-
65
-
66
-
67
-
68
-
69
-
70
-
71
-
72
-
73
-
74
-
75
-
76
-
77
-
78
-
79
-
80
-
81
-
82
-
83
-
84
-
85
-
86
-
87
-
88
-
89
-
90
-
91
-
92
-
93
-
94
-
95
-
96
-
97
-
98
-
99
-
100
-
101
-
102
-
103
-
104
-
105
-
106
-
107
-
108
-
109
-
110
-
111
-
112
-
113
-
114
-
115
-
116
-
117
-
118
-
119
-
120
-
121
-
122
-
123
-
124
-
125
-
126
-
127
-
128
-
129
-
130
-
131
-
132
-
133
-
134
-
135
-
136
-
137
-
138
-
139
-
140
 |
 |
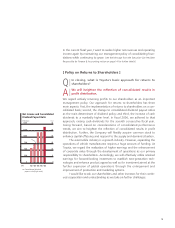
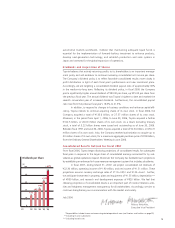
15
60
20
40
80
100
0
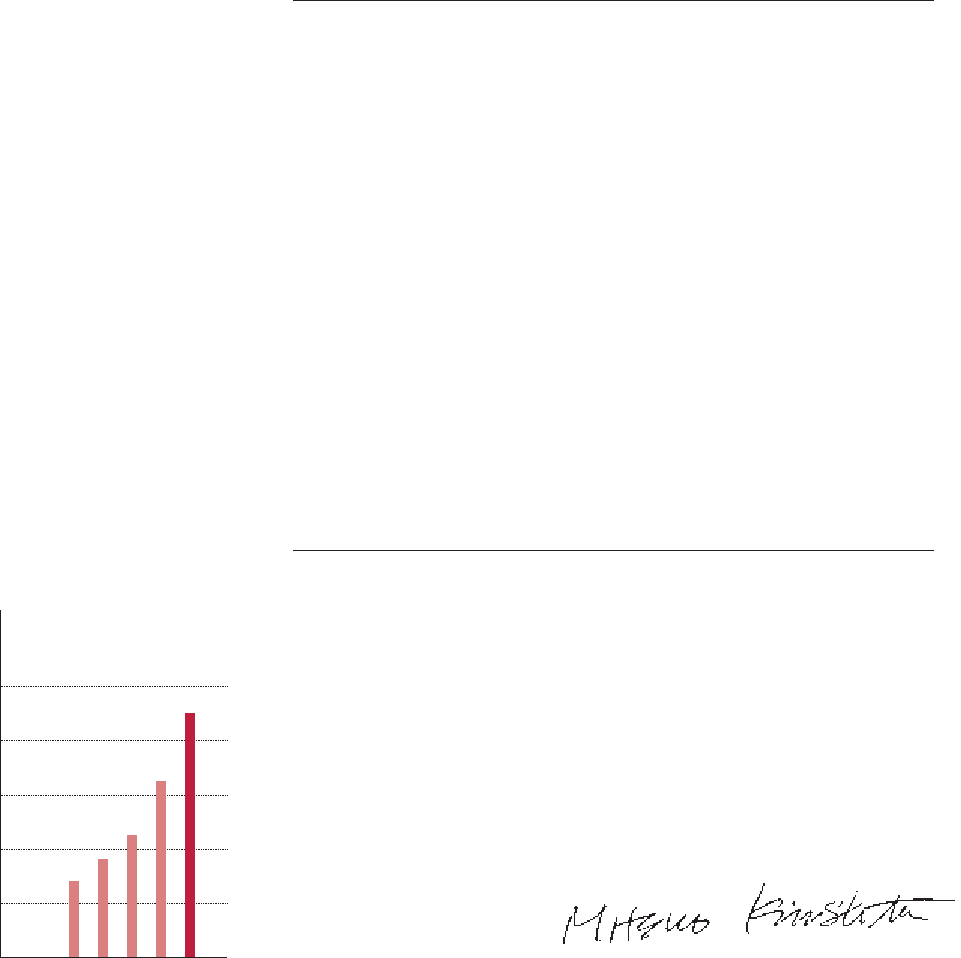
’02
28
’06
90
’05
65
’04
45
’03
36
Dividends per Share
(¥)
+¥25
FY
+¥20
+¥9
+¥8
+¥3
automotive markets worldwide, I believe that maintaining adequate liquid funds is
essential for the implementation of forward-looking investment to enhance products,
develop next-generation technology, and establish production and sales systems in
Japan and overseas for the global expansion of operations.
Dividends and Acquisition of Shares
Toyota believes that actively returning profits to its shareholders is an important manage-
ment policy and will endeavor to continue increasing consolidated net income per share.
The Company’s dividend policy is to reflect favorable consolidated results more closely in
profit distribution in light of each fiscal year’s performance and new investment plans.
Accordingly, we are targeting a consolidated dividend payout ratio of approximately 30%
in the medium-to-long term. Reflecting its dividend policy, in fiscal 2006 the Company
paid a significantly higher annual dividend of ¥90.00 per share, up ¥25.00 per share from
the previous fiscal year. The annual dividend was Toyota’s highest to date and marked the
seventh consecutive year of increased dividends. Furthermore, the consolidated payout
ratio rose from the previous fiscal year’s 18.3% to 21.3%.
In addition, to respond to changes in business conditions and enhance capital effi-
ciency, Toyota intends to continue acquiring shares of its own stock. In fiscal 2006, the
Company acquired a total of ¥133.6 billion, or 27.57 million shares of its own stock.
Moreover, in the period from April 1, 2006, to June 30, 2006, Toyota acquired a further
¥162.5 billion, or 26.00 million shares of its own stock. As a result, excluding treasury
stock, a total of 3.22 billion shares were issued and outstanding as of June 30, 2006.
Between fiscal 1997 and June 30, 2006, Toyota acquired a total of ¥2.34 trillion, or 653.72
million shares of its own stock. Also, the Company received authorization to acquire up to
30 million shares of its own stock, for a maximum aggregate purchase price of ¥200 billion,
from the Ordinary General Shareholders’ Meeting in June 2006.
Consolidated Results Outlook for Fiscal 2007
From fiscal 2006, Toyota began disclosing projections of consolidated results for subsequent
fiscal years in response to the larger share of consolidated earnings accounted for by sub-
sidiaries as global operations expand. Moreover, the Company has facilitated such projections
by establishing an enhanced in-house revenue management system that includes subsidiaries.
In fiscal 2007, ending March 31, 2007, we project consolidated net revenues of
¥22.30 trillion, operating income of ¥1.90 trillion, and net income of ¥1.31 trillion. These
projections assume currency exchange rates of ¥110=US$1 and ¥135=Euro1. Further,
we anticipate investment in property, plant and equipment of ¥1.55 trillion, depreciation***
of ¥930 billion, and research and development expenses of ¥920 billion. We feel that
releasing projections of consolidated results is an important part of investor relations activ-
ities and heightens management transparency for all stakeholders. Accordingly, we aim to
continue strengthening our communication with the market and society.
July 2006
Mitsuo Kinoshita,
Executive Vice President
*Responsibilities include finance and accounting related operational areas (see Directors and Auditors on page 50)
** Excluding finance subsidiaries
*** Excluding leased assets