Toyota 2006 Annual Report Download - page 78
Download and view the complete annual report
Please find page 78 of the 2006 Toyota annual report below. You can navigate through the pages in the report by either clicking on the pages listed below, or by using the keyword search tool below to find specific information within the annual report.-
 1
1 -
2
-
3
-
4
-
5
-
6
-
7
-
8
-
9
-
10
-
11
-
12
-
13
-
14
-
15
-
16
-
17
-
18
-
19
-
20
-
21
-
22
-
23
-
24
-
25
-
26
-
27
-
28
-
29
-
30
-
31
-
32
-
33
-
34
-
35
-
36
-
37
-
38
-
39
-
40
-
41
-
42
-
43
-
44
-
45
-
46
-
47
-
48
-
49
-
50
-
51
-
52
-
53
-
54
-
55
-
56
-
57
-
58
-
59
-
60
-
61
-
62
-
63
-
64
-
65
-
66
-
67
-
 68
68 -
 69
69 -
 70
70 -
 71
71 -
 72
72 -
 73
73 -
 74
74 -
 75
75 -
 76
76 -
 77
77 -
 78
78 -
 79
79 -
 80
80 -
 81
81 -
 82
82 -
 83
83 -
 84
84 -
 85
85 -
 86
86 -
 87
87 -
 88
88 -
89
-
90
-
91
-
92
-
93
-
94
-
95
-
96
-
97
-
98
-
99
-
100
-
101
-
102
-
103
-
104
-
105
-
106
-
107
-
108
-
109
-
110
-
111
-
112
-
113
-
114
-
115
-
116
-
117
-
118
-
119
-
120
-
121
-
122
-
123
-
124
-
125
-
126
-
127
-
128
-
129
-
130
-
131
-
132
-
133
-
134
-
135
-
136
-
137
-
138
-
139
-
140
 |
 |
76
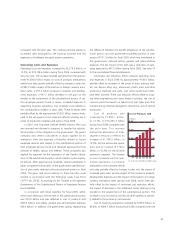
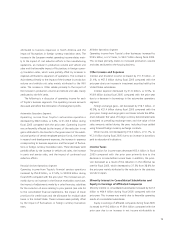
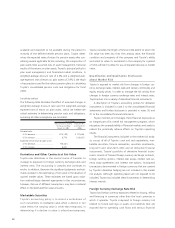
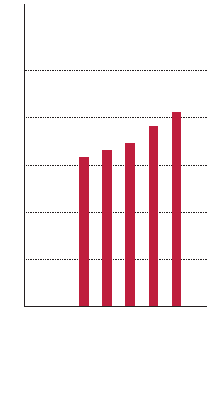
Liquid assets, which Toyota
defines as cash and cash equiva-
lents, time deposits, marketable
debt securities and its invest-
ment in monetary trust funds,
increased during fiscal 2006 by
¥286.8 billion, or 7.5%, to
¥4,096.8 billion.
Trade accounts and notes
receivable, net increased during
fiscal 2006 by ¥166.9 billion, or
9.2%, to ¥1,980.6 billion,
reflecting the impact of
increased revenues and the
impact of fluctuations in foreign
currency translation rates.
Inventories increased during fiscal 2006 by ¥314.2 billion,
or 24.1%, to ¥1,620.9 billion, reflecting the impact of increased
volumes and the impact of fluctuations in foreign currency
translation rates.
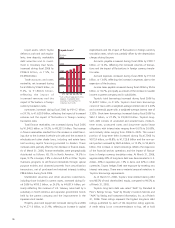
Total finance receivables, net increased during fiscal 2006
by ¥1,340.5 billion, or 19.2%, to ¥8,327.5 billion. The increase
in finance receivables resulted from the increase in retail financ-
ings due to the increase in vehicle unit sales and the increase in
wholesale and other dealer loans, including real estate loans
and working capital financing provided to dealers. These
increases were partially offset by the decrease in finance leases.
As of March 31, 2006, finance receivables were geographically
distributed as follows: 65.1% in North America, 14.3% in
Japan, 9.7% in Europe, 2.9% in Asia and 8.0% in Other. Toyota
maintains programs to sell finance receivables through special
purpose entities and obtained proceeds from securitization
transactions, net of purchased and retained interests totaling
¥88.6 billion during fiscal 2006.
Marketable securities and other securities investments,
including those included in current assets, increased during fis-
cal 2006 by ¥790.2 billion, or 24.3%, to ¥4,037.4 billion, pri-
marily reflecting the increase of U.S. treasury notes held by a
subsidiary in North America and Japanese government bonds
held by the parent company and the improvement in the
Japanese stock market.
Property, plant and equipment increased during fiscal 2006
by ¥1,271.0 billion, or 21.9%, reflecting an increase in capital
expenditures and the impact of fluctuations in foreign currency
translation rates, which was partially offset by the depreciation
charges during the year.
Accounts payable increased during fiscal 2006 by ¥229.7
billion, or 12.4%, reflecting the increased volumes of transac-
tions and the impact of fluctuations in foreign currency transla-
tion rates.
Accrued expenses increased during fiscal 2006 by ¥174.8
billion, or 13.6%, reflecting the increase in expenses due to the
expansion of the business.
Income taxes payable increased during fiscal 2006 by ¥54.6
billion, or 18.7%, principally as a result of the increase in taxable
income in parent company and in subsidiaries.
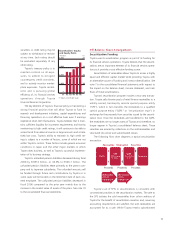
Toyota’s total borrowings increased during fiscal 2006 by
¥1,849.7 billion, or 21.6%. Toyota’s short-term borrowings
consist of loans with a weighted-average interest rate of 2.20%
and commercial paper with a weighted-average interest rate of
3.32%. Short-term borrowings increased during fiscal 2006 by
¥651.2 billion, or 27.3%, to ¥3,033.0 billion. Toyota’s long-
term debt consists of unsecured and secured loans, medium-
term notes, unsecured notes and long-term capital lease
obligations with interest rates ranging from 0.01% to 20.00%,
and maturity dates ranging from 2006 to 2035. The current
portion of long-term debt increased during fiscal 2006 by
¥572.9 billion, or 49.8%, to ¥1,723.8 billion and the non-cur-
rent portion increased by ¥625.6 billion, or 12.5%, to ¥5,640.5
billion. The increase in total borrowings reflects the expansion
of the financial services operations and the impact of fluctua-
tions in foreign currency translation rates. At March 31, 2006,
approximately 39% of long-term debt was denominated in U.S.
dollars, 26% in Japanese yen, 13% in euros and 22% in other
currencies. Toyota hedges fixed rate exposure by entering into
interest rate swaps. There are no material seasonal variations in
Toyota’s borrowings requirements.
As of March 31, 2006, Toyota’s total interest bearing debt
was 98.5% of total shareholders’ equity, compared to 94.5% as
of March 31, 2005.
Toyota’s long-term debt was rated “AAA” by Standard &
Poor’s Ratings Group, “Aaa” by Moody’s Investors Services and
“AAA” by Rating and Investment Information, Inc. as of March
31, 2006. These ratings represent the highest long-term debt
ratings published by each of the respective rating agencies.
Acredit rating is not a recommendation to buy, sell or hold
3,000
2,000
1,000
4,000
5,000
’02 ’03 ’04 ’05 ’06
0
Liquid Assets*
(¥ Billion)
FY
* Cash and cash equivalents, time
deposits, marketable debt
securities and investment in
monetary trust funds