Toyota 2006 Annual Report Download - page 31
Download and view the complete annual report
Please find page 31 of the 2006 Toyota annual report below. You can navigate through the pages in the report by either clicking on the pages listed below, or by using the keyword search tool below to find specific information within the annual report.-
 1
1 -
2
-
3
-
4
-
5
-
6
-
7
-
8
-
9
-
10
-
11
-
12
-
13
-
14
-
15
-
16
-
17
-
18
-
19
-
20
-
 21
21 -
 22
22 -
 23
23 -
 24
24 -
 25
25 -
 26
26 -
 27
27 -
 28
28 -
 29
29 -
 30
30 -
 31
31 -
 32
32 -
 33
33 -
 34
34 -
 35
35 -
 36
36 -
 37
37 -
 38
38 -
 39
39 -
 40
40 -
 41
41 -
42
-
43
-
44
-
45
-
46
-
47
-
48
-
49
-
50
-
51
-
52
-
53
-
54
-
55
-
56
-
57
-
58
-
59
-
60
-
61
-
62
-
63
-
64
-
65
-
66
-
67
-
68
-
69
-
70
-
71
-
72
-
73
-
74
-
75
-
76
-
77
-
78
-
79
-
80
-
81
-
82
-
83
-
84
-
85
-
86
-
87
-
88
-
89
-
90
-
91
-
92
-
93
-
94
-
95
-
96
-
97
-
98
-
99
-
100
-
101
-
102
-
103
-
104
-
105
-
106
-
107
-
108
-
109
-
110
-
111
-
112
-
113
-
114
-
115
-
116
-
117
-
118
-
119
-
120
-
121
-
122
-
123
-
124
-
125
-
126
-
127
-
128
-
129
-
130
-
131
-
132
-
133
-
134
-
135
-
136
-
137
-
138
-
139
-
140
 |
 |
29
10,000
15,000
20,000
1,000
5,000 500
1,500
2,000
’02 ’03 ’04 ’05 ’06
FY
Revenues and
Operating Income
(¥ Billion) (¥ Billion)
Revenues Operating income (Right scale)
00
600
400
200
800
1,000
150
100
50
200
250
’02 ’03 ’04 ’05 ’06
FY
Revenues and
Operating Income
(¥ Billion) (¥ Billion)
Revenues Operating income (Right scale)
00
600
300
–300 –10
0
900
1,200
20
10
0
30
40
’02 ’03 ’04 ’05 ’06
FY
Revenues and
Operating Income (Loss)
(¥ Billion) (¥ Billion)
Revenues
Operating income (loss)
(Right scale)
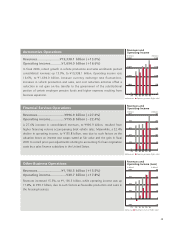
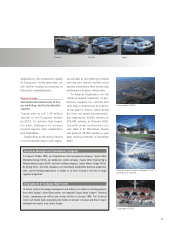
Automotive Operations
Revenues........................¥19,338.1 billion (+13.0%)
Operating income............¥1,694.0 billion (+16.6%)
In fiscal 2006, robust growth in vehicle production and sales worldwide pushed
consolidated revenues up 13.0%, to ¥19,338.1 billion. Operating income rose
16.6%, to ¥1,694.0 billion, because currency exchange rate fluctuations,
increases in vehicle production and sales, and cost reduction activities offset a
reduction in net gain on the transfer to the government of the substitutional
portion of certain employee pension funds and higher expenses resulting from
business expansion.
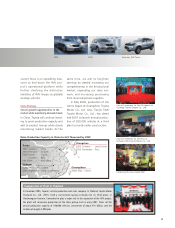
Financial Services Operations
Revenues.............................¥996.9 billion (+27.6%)
Operating income...............¥155.8 billion ( – 22.4%)
A 27.6% increase in consolidated revenues, to ¥996.9 billion, resulted from
higher financing volume accompanying brisk vehicle sales. Meanwhile, a 22.4%
decline in operating income, to ¥155.8 billion, was due to such factors as the
valuation losses on interest rate swaps stated at fair value and the gain in fiscal
2005 to record prior-year adjustments relating to accounting for loan origination
costs by a sales finance subsidiary in the United States.
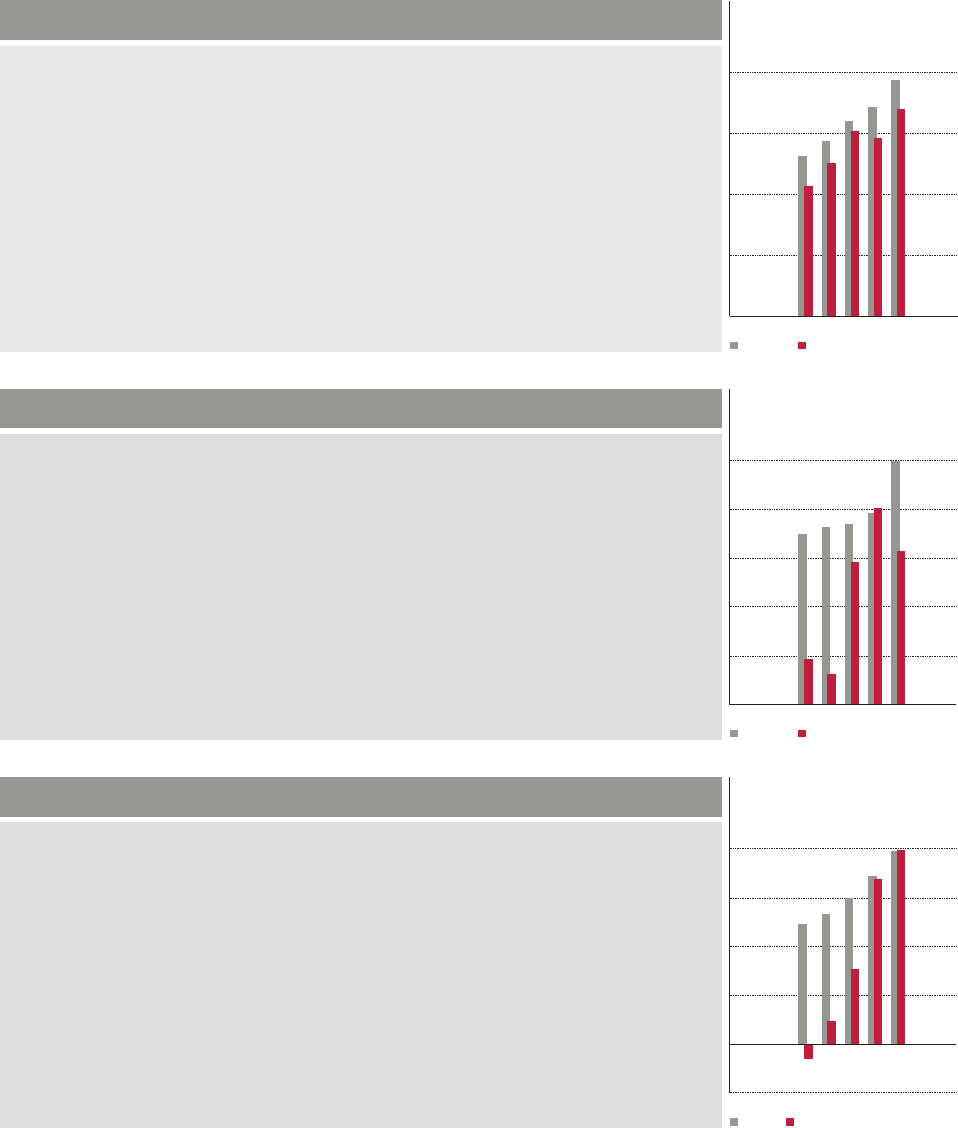
Other Business Operations
Revenues..........................¥1,190.3 billion (+15.5%)
Operating income.................¥39.7 billion (+17.8%)
Revenues increased 15.5%, to ¥1,190.3 billion, while operating income was up
17.8%, to ¥39.7 billion, due to such factors as favorable production and sales in
the housing business.