Toyota 2006 Annual Report Download - page 127
Download and view the complete annual report
Please find page 127 of the 2006 Toyota annual report below. You can navigate through the pages in the report by either clicking on the pages listed below, or by using the keyword search tool below to find specific information within the annual report.-
 1
1 -
2
-
3
-
4
-
5
-
6
-
7
-
8
-
9
-
10
-
11
-
12
-
13
-
14
-
15
-
16
-
17
-
18
-
19
-
20
-
21
-
22
-
23
-
24
-
25
-
26
-
27
-
28
-
29
-
30
-
31
-
32
-
33
-
34
-
35
-
36
-
37
-
38
-
39
-
40
-
41
-
42
-
43
-
44
-
45
-
46
-
47
-
48
-
49
-
50
-
51
-
52
-
53
-
54
-
55
-
56
-
57
-
58
-
59
-
60
-
61
-
62
-
63
-
64
-
65
-
66
-
67
-
68
-
69
-
70
-
71
-
72
-
73
-
74
-
75
-
76
-
77
-
78
-
79
-
80
-
81
-
82
-
83
-
84
-
85
-
86
-
87
-
88
-
89
-
90
-
91
-
92
-
93
-
94
-
95
-
96
-
97
-
98
-
99
-
100
-
101
-
102
-
103
-
104
-
105
-
106
-
107
-
108
-
109
-
110
-
111
-
112
-
113
-
114
-
115
-
116
-
 117
117 -
 118
118 -
 119
119 -
 120
120 -
 121
121 -
 122
122 -
 123
123 -
 124
124 -
 125
125 -
 126
126 -
 127
127 -
 128
128 -
 129
129 -
 130
130 -
 131
131 -
 132
132 -
 133
133 -
 134
134 -
 135
135 -
 136
136 -
 137
137 -
138
-
139
-
140
 |
 |

125
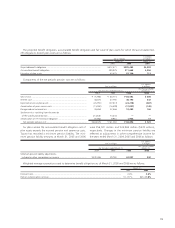
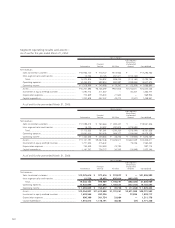
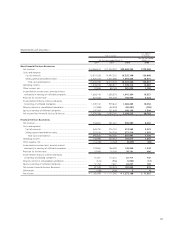
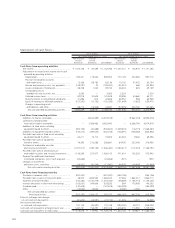
Certain financial statement data on non-financial services and financial services businesses—
The financial data below presents separately Toyota’s non-financial services and financial services businesses.
Balance sheets—
U.S.dollars
Yen in millions in millions
March 31, March 31,
2005 2006 2006
Non-Financial Services Businesses
Current assets
Cash and cash equivalents..................................................................................... ¥ 1,324,126 ¥1,418,022 $ 12,071
Time deposits........................................................................................................ 8,006 14,024 119
Marketable securities ............................................................................................ 541,785 633,036 5,389
Trade accounts and notes receivable, less allowance for doubtful accounts............ 1,837,539 2,002,577 17,048
Inventories............................................................................................................ 1,306,709 1,620,975 13,799
Prepaid expenses and other current assets............................................................. 1,382,987 1,466,019 12,480
Total current assets ........................................................................................... 6,401,152 7,154,653 60,906
Investments and other assets..................................................................................... 4,804,843 5,702,376 48,543
Property, plant and equipment.................................................................................. 4,579,052 5,207,760 44,333
Total Non-Financial Services Businesses assets.................................................... 15,785,047 18,064,789 153,782
Financial Services Businesses
Current assets
Cash and cash equivalents..................................................................................... 159,627 151,365 1,289
Time deposits........................................................................................................ 55,603 36,325 309
Marketable securities ............................................................................................ 1,339 1,843 16
Finance receivables, net......................................................................................... 3,010,135 3,497,319 29,772
Prepaid expenses and other current assets............................................................. 609,946 674,522 5,742
Total current assets ........................................................................................... 3,836,650 4,361,374 37,128
Noncurrent finance receivables, net........................................................................... 3,976,941 4,830,216 41,119
Investments and other assets..................................................................................... 457,115 563,050 4,793
Property, plant and equipment.................................................................................. 1,216,542 1,858,868 15,824
Total Financial Services Businesses assets ........................................................... 9,487,248 11,613,508 98,864
Eliminations .............................................................................................................. (937,284) (946,702) (8,059)
Total assets....................................................................................................... ¥24,335,011 ¥28,731,595 $244,587
Assets in the non-financial service include unallocated corporate assets.