Toyota 2006 Annual Report Download - page 63
Download and view the complete annual report
Please find page 63 of the 2006 Toyota annual report below. You can navigate through the pages in the report by either clicking on the pages listed below, or by using the keyword search tool below to find specific information within the annual report.-
 1
1 -
2
-
3
-
4
-
5
-
6
-
7
-
8
-
9
-
10
-
11
-
12
-
13
-
14
-
15
-
16
-
17
-
18
-
19
-
20
-
21
-
22
-
23
-
24
-
25
-
26
-
27
-
28
-
29
-
30
-
31
-
32
-
33
-
34
-
35
-
36
-
37
-
38
-
39
-
40
-
41
-
42
-
43
-
44
-
45
-
46
-
47
-
48
-
49
-
50
-
51
-
52
-
 53
53 -
 54
54 -
 55
55 -
 56
56 -
 57
57 -
 58
58 -
 59
59 -
 60
60 -
 61
61 -
 62
62 -
 63
63 -
 64
64 -
 65
65 -
 66
66 -
 67
67 -
 68
68 -
 69
69 -
 70
70 -
 71
71 -
 72
72 -
 73
73 -
74
-
75
-
76
-
77
-
78
-
79
-
80
-
81
-
82
-
83
-
84
-
85
-
86
-
87
-
88
-
89
-
90
-
91
-
92
-
93
-
94
-
95
-
96
-
97
-
98
-
99
-
100
-
101
-
102
-
103
-
104
-
105
-
106
-
107
-
108
-
109
-
110
-
111
-
112
-
113
-
114
-
115
-
116
-
117
-
118
-
119
-
120
-
121
-
122
-
123
-
124
-
125
-
126
-
127
-
128
-
129
-
130
-
131
-
132
-
133
-
134
-
135
-
136
-
137
-
138
-
139
-
140
 |
 |

61
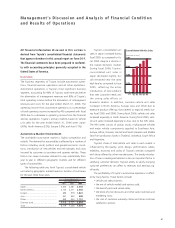
Management’s Discussion and Analysis of Financial Condition
and Results of Operations
All financial information discussed in this section is
derived from Toyota’s consolidated financial statements
that appear elsewhere in this annual report on Form 20-F.
The financial statements have been prepared in conformi-
ty with accounting principles generally accepted in the
United States of America.
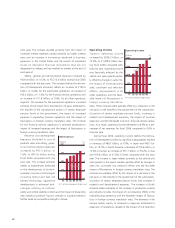
Overview
The business segments of Toyota include automotive opera-
tions, financial services operations and all other operations.
Automotive operations is Toyota’s most significant business
segment, accounting for 90% of Toyota’s total revenues before
the elimination of intersegment revenues and 90% of Toyota’s
total operating income before the elimination of intersegment
revenues and costs for the year ended March 31, 2006. The
operating income from automotive operations as a percentage
of total operating income increased by 4% compared with fiscal
2005 due to a decrease in operating income from the financial
services operations. Toyota’s primary markets based on vehicle
unit sales for the year ended March 31, 2006 were: Japan
(30%), North America (32%), Europe (13%), and Asia (11%).
Automotive Market Environment
The worldwide automotive market is highly competitive and
volatile. The demand for automobiles is affected by a number of
factors including social, political and general economic condi-
tions; introduction of new vehicles and technologies; and costs
incurred by customers to purchase and operate vehicles. These
factors can cause consumer demand to vary substantially from
year to year in different geographic markets and for different
types of automobiles.
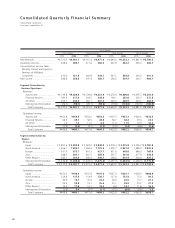
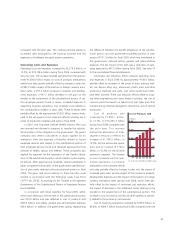
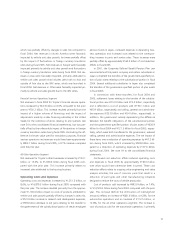
The following table sets forth Toyota’s consolidated vehicle
unit sales by geographic market based on location of customers
for the past three fiscal years.
Thousands of units
Year ended March 31,
2004 2005 2006
Japan..................................................... 2,303 2,381 2,364
North America....................................... 2,103 2,271 2,556
Europe................................................... 898 979 1,023
Asia ....................................................... 557 833 880
Other..................................................... 858 944 1,151
Overseas total........................................ 4,416 5,027 5,610
Total...................................................... 6,719 7,408 7,974
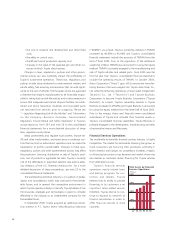
Toyota’s consolidated unit
sales in Japan increased during
fiscal 2005 as compared to fis-
cal 2004 despite a decline in
the overall domestic market.
During fiscal 2006, Toyota’s
consolidated unit sales in
Japan decreased slightly, but
still remained near the same
high level as compared to fiscal
2005, reflecting the active
introduction of new products
that met customer needs and
the strong sales efforts of
domestic dealers. In addition, overseas vehicle unit sales
increased in North America, Europe, Asia and Other due to
extensive product offerings that catered to regional needs dur-
ing fiscal 2005 and 2006. During fiscal 2006, vehicle unit sales
increased especially in North America. During fiscal 2005, vehi-
cle unit sales increased especially in Asia, due to the IMV series.
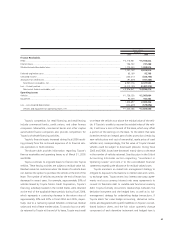
The IMV series consist of pickup trucks, multipurpose vehicles
and major vehicle components supplied to Southeast Asia,
Europe, Africa, Oceania, Central and South America and Middle
East from production bases in Thailand, Indonesia, South Africa
and Argentina.
Toyota’s share of total vehicle unit sales in each market is
influenced by the quality, price, design, performance, safety,
reliability, economy and utility of Toyota’s vehicles compared
with those offered by other manufacturers. The timely introduc-
tion of new or redesigned vehicles is also an important factor in
satisfying customer demand. Toyota’s ability to satisfy changing
customer preferences can affect its revenues and earnings sig-
nificantly.
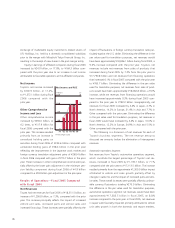
The profitability of Toyota’s automotive operations is affect-
ed by many factors. These factors include:
• vehicle unit sales volumes,
• the mix of vehicle models and options sold,
• the level of parts and service sales,
• the levels of price discounts and other sales incentives and
marketing costs,
• the cost of customer warranty claims and other customer
satisfaction actions,
4,000
2,000
6,000
8,000
’02 ’03 ’04 ’05 ’06
0
Consolidated Vehicle Sales
(Thousands of units)
FY