Toyota 2006 Annual Report Download - page 126
Download and view the complete annual report
Please find page 126 of the 2006 Toyota annual report below. You can navigate through the pages in the report by either clicking on the pages listed below, or by using the keyword search tool below to find specific information within the annual report.-
 1
1 -
2
-
3
-
4
-
5
-
6
-
7
-
8
-
9
-
10
-
11
-
12
-
13
-
14
-
15
-
16
-
17
-
18
-
19
-
20
-
21
-
22
-
23
-
24
-
25
-
26
-
27
-
28
-
29
-
30
-
31
-
32
-
33
-
34
-
35
-
36
-
37
-
38
-
39
-
40
-
41
-
42
-
43
-
44
-
45
-
46
-
47
-
48
-
49
-
50
-
51
-
52
-
53
-
54
-
55
-
56
-
57
-
58
-
59
-
60
-
61
-
62
-
63
-
64
-
65
-
66
-
67
-
68
-
69
-
70
-
71
-
72
-
73
-
74
-
75
-
76
-
77
-
78
-
79
-
80
-
81
-
82
-
83
-
84
-
85
-
86
-
87
-
88
-
89
-
90
-
91
-
92
-
93
-
94
-
95
-
96
-
97
-
98
-
99
-
100
-
101
-
102
-
103
-
104
-
105
-
106
-
107
-
108
-
109
-
110
-
111
-
112
-
113
-
114
-
115
-
 116
116 -
 117
117 -
 118
118 -
 119
119 -
 120
120 -
 121
121 -
 122
122 -
 123
123 -
 124
124 -
 125
125 -
 126
126 -
 127
127 -
 128
128 -
 129
129 -
 130
130 -
 131
131 -
 132
132 -
 133
133 -
 134
134 -
 135
135 -
 136
136 -
137
-
138
-
139
-
140
 |
 |

124
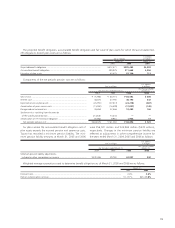
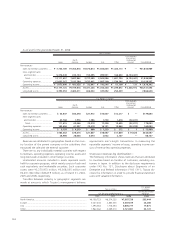
Revenues are attributed to geographies based on the coun-
try location of the parent company or the subsidiary that
transacted the sale with the external customer.
There are no any individually material countries with respect
to revenues, operating expenses, operating income, assets and
long-lived assets included in other foreign countries.
Unallocated amounts included in assets represent assets
held for corporate purposes, which mainly consist of cash and
cash equivalents and marketable securities. Such corporate
assets were ¥3,270,973 million, ¥3,308,055 million and
¥4,231,148 million ($36,019 million), as of March 31, 2004,
2005 and 2006, respectively.
Transfers between industry or geographic segments are
made at amounts which Toyota’s management believes
approximate arm’s-length transactions. In measuring the
reportable segments’ income or losses, operating income con-
sists of revenue less operating expenses.
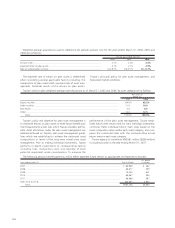
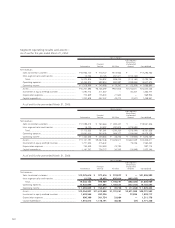
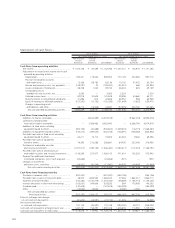
Overseas revenues by destination—
The following information shows revenues that are attributed
to countries based on location of customers, excluding cus-
tomers in Japan. In addition to the disclosure requirements
under FAS No. 131, Disclosure about Segments of an
Enterprise and Related Information (“FAS 131”), Toyota dis-
closes this information in order to provide financial statement
users with valuable information.
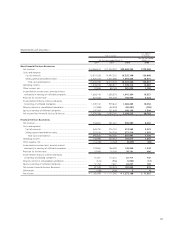
As of and for the year ended March 31, 2006:
Yen in millions
Inter-segment
Elimination/
North Unallocated
Japan America Europe Asia Other Amount Consolidated
Net revenues
Sales to external customers ...... ¥7,735,109 ¥7,455,818 ¥2,574,014 ¥1,836,855 ¥1,435,113 ¥ — ¥21,036,909
Inter-segment sales
and transfers.......................... 5,376,348 232,124 153,395 205,951 166,623 (6,134,441) —
Total.................................... 13,111,457 7,687,942 2,727,409 2,042,806 1,601,736 (6,134,441) 21,036,909
Operating expenses.................. 12,035,567 7,192,304 2,633,462 1,897,260 1,534,546 (6,134,572) 19,158,567
Operating income .................... ¥1,075,890 ¥ 495,638 ¥ 93,947 ¥ 145,546 ¥ 67,190 ¥ 131 ¥ 1,878,342
Assets ...................................... ¥12,177,125 ¥9,199,818 ¥2,471,258 ¥1,255,350 ¥1,299,072 ¥ 2,328,972 ¥28,731,595
Long-lived assets...................... 3,395,553 2,403,211 666,543 347,892 253,429 — 7,066,628
U.S. dollars in millions
Inter-segment
Elimination/
North Unallocated
Japan America Europe Asia Other Amount Consolidated
Net revenues
Sales to external customers ...... $65,847 $63,470 $21,912 $15,637 $12,217 $ — $179,083
Inter-segment sales
and transfers.......................... 45,768 1,976 1,306 1,753 1,418 (52,221) —
Total.................................... 111,615 65,446 23,218 17,390 13,635 (52,221) 179,083
Operating expenses.................. 102,456 61,227 22,418 16,151 13,063 (52,222) 163,093
Operating income .................... $9,159 $ 4,219 $ 800 $ 1,239 $ 572 $ 1 $ 15,990
Assets ...................................... $103,662 $78,316 $21,037 $10,687 $11,059 $ 19,826 $244,587
Long-lived assets...................... 28,906 20,458 5,674 2,962 2,157 — 60,157
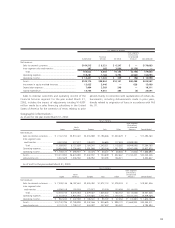
U.S. dollars
Yen in millions in millions
For the year ended
For the years ended March 31, March 31,
2004 2005 2006 2006
North America....................................................................................... ¥6,108,723 ¥6,374,235 ¥7,687,738 $65,444
Europe .................................................................................................. 2,037,344 2,365,525 2,607,819 22,200
Asia ..................................................................................................... 1,393,084 1,776,554 2,005,777 17,075
Other .................................................................................................... 1,962,064 2,089,210 2,721,981 23,172