Toyota 2006 Annual Report Download - page 61
Download and view the complete annual report
Please find page 61 of the 2006 Toyota annual report below. You can navigate through the pages in the report by either clicking on the pages listed below, or by using the keyword search tool below to find specific information within the annual report.-
 1
1 -
2
-
3
-
4
-
5
-
6
-
7
-
8
-
9
-
10
-
11
-
12
-
13
-
14
-
15
-
16
-
17
-
18
-
19
-
20
-
21
-
22
-
23
-
24
-
25
-
26
-
27
-
28
-
29
-
30
-
31
-
32
-
33
-
34
-
35
-
36
-
37
-
38
-
39
-
40
-
41
-
42
-
43
-
44
-
45
-
46
-
47
-
48
-
49
-
50
-
 51
51 -
 52
52 -
 53
53 -
 54
54 -
 55
55 -
 56
56 -
 57
57 -
 58
58 -
 59
59 -
 60
60 -
 61
61 -
 62
62 -
 63
63 -
 64
64 -
 65
65 -
 66
66 -
 67
67 -
 68
68 -
 69
69 -
 70
70 -
 71
71 -
72
-
73
-
74
-
75
-
76
-
77
-
78
-
79
-
80
-
81
-
82
-
83
-
84
-
85
-
86
-
87
-
88
-
89
-
90
-
91
-
92
-
93
-
94
-
95
-
96
-
97
-
98
-
99
-
100
-
101
-
102
-
103
-
104
-
105
-
106
-
107
-
108
-
109
-
110
-
111
-
112
-
113
-
114
-
115
-
116
-
117
-
118
-
119
-
120
-
121
-
122
-
123
-
124
-
125
-
126
-
127
-
128
-
129
-
130
-
131
-
132
-
133
-
134
-
135
-
136
-
137
-
138
-
139
-
140
 |
 |

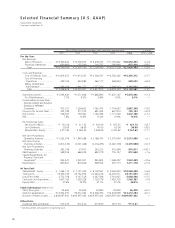
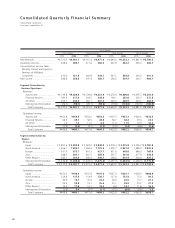
59
Yen in millions % change
2004 2005 2006 2005 vs 2006
By Business Operations:
Revenues:
Automotive .................................................................. ¥15,973,826 ¥17,113,535 ¥19,338,144 +13.0
Financial Services.......................................................... 736,852 781,261 996,909 +27.6
All Other ...................................................................... 896,244 1,030,320 1,190,291 +15.5
Intersegment Elimination.............................................. (312,162) (373,590) (488,435) +30.7
Total Company.......................................................... ¥17,294,760 ¥18,551,526 ¥21,036,909 +13.4
Operating Income:
Automotive .................................................................. ¥1,518,954 ¥1,452,535 ¥1,694,045 +16.6
Financial Services.......................................................... 145,998 200,853 155,817 –22.4
All Other ...................................................................... 15,247 33,743 39,748 +17.8
Intersegment Elimination.............................................. (13,309) (14,944) (11,268) –24.6
Total Company.......................................................... ¥1,666,890 ¥1,672,187 ¥1,878,342 +12.3
By Region:
Revenues (External Customers):
Japan ........................................................................... ¥ 7,167,704 ¥ 7,408,136 ¥ 7,735,109 +4.4
North America.............................................................. 5,910,422 6,187,624 7,455,818 +20.5
Europe ......................................................................... 2,018,969 2,305,450 2,574,014 +11.6
Asia.............................................................................. 1,196,836 1,572,113 1,836,855 +16.8
Other Regions .............................................................. 1,000,829 1,078,203 1,435,113 +33.1
Total Company.......................................................... ¥17,294,760 ¥18,551,526 ¥21,036,909 +13.4
Operating Income:
Japan ........................................................................... ¥1,108,127 ¥ 987,242 ¥1,075,890 +9.0
North America.............................................................. 390,977 447,559 495,638 +10.7
Europe ......................................................................... 72,475 108,541 93,947 –13.4
Asia.............................................................................. 60,277 93,772 145,546 +55.2
Other Regions .............................................................. 36,636 47,454 67,190 +41.6
Intersegment Elimination.............................................. (1,602) (12,381) 131 –101.1
Total Company.......................................................... ¥1,666,890 ¥1,672,187 ¥1,878,342 +12.3
Consolidated Segment Information
Toyota Motor Corporation
Fiscal years ended March 31