Toyota 2006 Annual Report Download - page 125
Download and view the complete annual report
Please find page 125 of the 2006 Toyota annual report below. You can navigate through the pages in the report by either clicking on the pages listed below, or by using the keyword search tool below to find specific information within the annual report.-
 1
1 -
2
-
3
-
4
-
5
-
6
-
7
-
8
-
9
-
10
-
11
-
12
-
13
-
14
-
15
-
16
-
17
-
18
-
19
-
20
-
21
-
22
-
23
-
24
-
25
-
26
-
27
-
28
-
29
-
30
-
31
-
32
-
33
-
34
-
35
-
36
-
37
-
38
-
39
-
40
-
41
-
42
-
43
-
44
-
45
-
46
-
47
-
48
-
49
-
50
-
51
-
52
-
53
-
54
-
55
-
56
-
57
-
58
-
59
-
60
-
61
-
62
-
63
-
64
-
65
-
66
-
67
-
68
-
69
-
70
-
71
-
72
-
73
-
74
-
75
-
76
-
77
-
78
-
79
-
80
-
81
-
82
-
83
-
84
-
85
-
86
-
87
-
88
-
89
-
90
-
91
-
92
-
93
-
94
-
95
-
96
-
97
-
98
-
99
-
100
-
101
-
102
-
103
-
104
-
105
-
106
-
107
-
108
-
109
-
110
-
111
-
112
-
113
-
114
-
 115
115 -
 116
116 -
 117
117 -
 118
118 -
 119
119 -
 120
120 -
 121
121 -
 122
122 -
 123
123 -
 124
124 -
 125
125 -
 126
126 -
 127
127 -
 128
128 -
 129
129 -
 130
130 -
 131
131 -
 132
132 -
 133
133 -
 134
134 -
 135
135 -
136
-
137
-
138
-
139
-
140
 |
 |
123
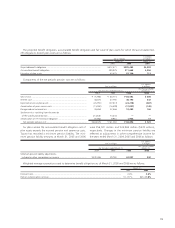
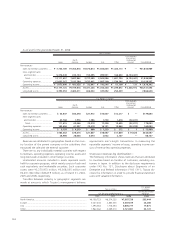
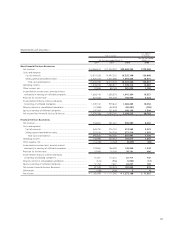
Sales to external customers and operating income of the
Financial Services segment for the year ended March 31,
2005, includes the impact of adjustments totaling ¥14,991
million made by a sales financing subsidiary in the United
States of America for the correction of errors relating to prior
periods mainly in connection with capitalization of certain dis-
bursements, including disbursements made in prior years,
directly related to origination of loans in accordance with FAS
No. 91.
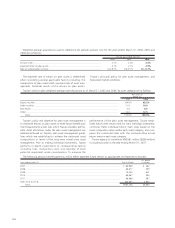
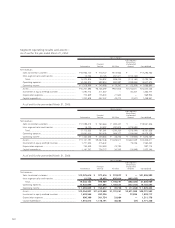
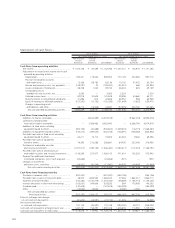
Geographic information—
As of and for the year ended March 31, 2004:
Yen in millions
Inter-segment
Elimination/
North Unallocated
Japan America Europe Asia Other Amount Consolidated
Net revenues
Sales to external customers ...... ¥ 7,167,704 ¥5,910,422 ¥2,018,969 ¥1,196,836 ¥1,000,829 ¥ — ¥17,294,760
Inter-segment sales
and transfers.......................... 4,422,283 217,217 145,372 46,685 117,533 (4,949,090) —
Total.................................... 11,589,987 6,127,639 2,164,341 1,243,521 1,118,362 (4,949,090) 17,294,760
Operating expenses.................. 10,481,860 5,736,662 2,091,866 1,183,244 1,081,726 (4,947,488) 15,627,870
Operating income .................... ¥ 1,108,127 ¥ 390,977 ¥ 72,475 ¥ 60,277 ¥ 36,636 ¥ (1,602) ¥ 1,666,890
Assets ...................................... ¥10,210,904 ¥6,674,694 ¥1,842,947 ¥ 734,609 ¥ 832,667 ¥1,744,407 ¥22,040,228
Long-lived assets...................... 3,032,629 1,536,550 448,954 180,493 156,021 — 5,354,647
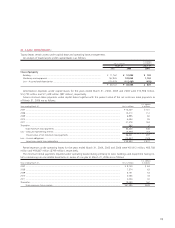
As of and for the year ended March 31, 2005:
Yen in millions
Inter-segment
Elimination/
North Unallocated
Japan America Europe Asia Other Amount Consolidated
Net revenues
Sales to external customers ...... ¥ 7,408,136 ¥6,187,624 ¥2,305,450 ¥1,572,113 ¥1,078,203 ¥ — ¥18,551,526
Inter-segment sales
and transfers.......................... 4,596,019 185,829 173,977 53,309 105,499 (5,114,633) —
Total.................................... 12,004,155 6,373,453 2,479,427 1,625,422 1,183,702 (5,114,633) 18,551,526
Operating expenses.................. 11,016,913 5,925,894 2,370,886 1,531,650 1,136,248 (5,102,252) 16,879,339
Operating income .................... ¥ 987,242 ¥ 447,559 ¥ 108,541 ¥ 93,772 ¥ 47,454 ¥ (12,381) ¥ 1,672,187
Assets ...................................... ¥10,740,796 ¥7,738,898 ¥2,242,566 ¥ 945,635 ¥ 998,172 ¥1,668,944 ¥24,335,011
Long-lived assets...................... 3,110,123 1,708,147 544,597 247,507 185,220 — 5,795,594
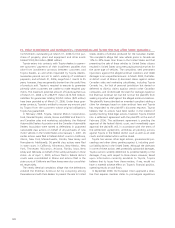
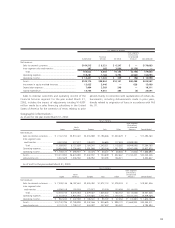
U.S. dollars in millions
Inter-segment
Elimination/
Financial Unallocated
Automotive Services All Other Amount Consolidated
Net revenues
Sales to external customers ............................................. $164,515 $ 8,321 $ 6,247 $ — $179,083
Inter-segment sales and transfers .................................... 107 165 3,886 (4,158) —
Total........................................................................... 164,622 8,486 10,133 (4,158) 179,083
Operating expenses......................................................... 150,201 7,160 9,794 (4,062) 163,093
Operating income ........................................................... $14,421 $ 1,326 $ 339 $ (96) $ 15,990
Assets ............................................................................. $105,174 $98,864 $10,141 $30,408 $244,587
Investment in equity method investees ............................ 12,425 2,446 — 628 15,499
Depreciation expenses..................................................... 7,494 2,569 248 — 10,311
Capital expenditure ......................................................... 13,755 9,451 385 (0) 23,591