Toyota 2006 Annual Report Download - page 131
Download and view the complete annual report
Please find page 131 of the 2006 Toyota annual report below. You can navigate through the pages in the report by either clicking on the pages listed below, or by using the keyword search tool below to find specific information within the annual report.-
 1
1 -
2
-
3
-
4
-
5
-
6
-
7
-
8
-
9
-
10
-
11
-
12
-
13
-
14
-
15
-
16
-
17
-
18
-
19
-
20
-
21
-
22
-
23
-
24
-
25
-
26
-
27
-
28
-
29
-
30
-
31
-
32
-
33
-
34
-
35
-
36
-
37
-
38
-
39
-
40
-
41
-
42
-
43
-
44
-
45
-
46
-
47
-
48
-
49
-
50
-
51
-
52
-
53
-
54
-
55
-
56
-
57
-
58
-
59
-
60
-
61
-
62
-
63
-
64
-
65
-
66
-
67
-
68
-
69
-
70
-
71
-
72
-
73
-
74
-
75
-
76
-
77
-
78
-
79
-
80
-
81
-
82
-
83
-
84
-
85
-
86
-
87
-
88
-
89
-
90
-
91
-
92
-
93
-
94
-
95
-
96
-
97
-
98
-
99
-
100
-
101
-
102
-
103
-
104
-
105
-
106
-
107
-
108
-
109
-
110
-
111
-
112
-
113
-
114
-
115
-
116
-
117
-
118
-
119
-
120
-
 121
121 -
 122
122 -
 123
123 -
 124
124 -
 125
125 -
 126
126 -
 127
127 -
 128
128 -
 129
129 -
 130
130 -
 131
131 -
 132
132 -
 133
133 -
 134
134 -
 135
135 -
 136
136 -
 137
137 -
 138
138 -
 139
139 -
 140
140
 |
 |

129
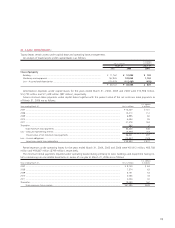
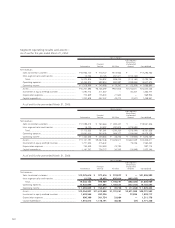
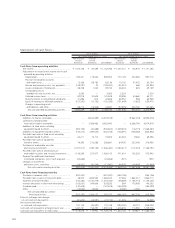
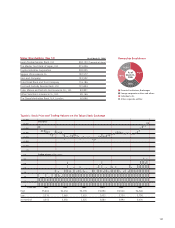
Yen in millions U.S. dollars in millions
For the year ended March 31, 2006 For the year ended March 31, 2006
Non-Financial Financial Non-Financial Financial
Services Services Services Services
Businesses Businesses Consolidated Businesses Businesses Consolidated
Cash flows from operating activities
Net income ............................................................ ¥ 1,264,223 ¥107,952 ¥ 1,372,180 $ 10,762 $ 919 $ 11,681
Adjustments to reconcile net income
to net cash provided by operating activities
Depreciation....................................................... 909,444 301,734 1,211,178 7,742 2,569 10,311
Provision for doubtful accounts and credit losses ... 10,361 52,285 62,646 88 445 533
Pension and severance costs, less payments ........ 22,664 1,196 23,860 193 10 203
Losses on disposal of fixed assets........................ 54,614 367 54,981 465 3 468
Unrealized losses on
available-for-sale securities, net ........................ 4,163 — 4,163 36 — 36
Deferred income taxes........................................ 31,370 1,889 33,262 267 16 283
Minority interest in consolidated subsidiaries ...... 82,401 1,992 84,393 701 17 718
Equity in earnings of affiliated companies ........... (142,139) (22,227) (164,366) (1,210) (189) (1,399)
Changes in operating assets
and liabilities, and other ................................... (214,507) 138,766 (166,817) (1,826) 1,181 (1,420)
Net cash provided by operating activities ........ 2,022,594 583,954 2,515,480 17,218 4,971 21,414
Cash flows from investing activities
Additions to finance receivables.............................. —(11,407,390) (6,476,979) — (97,109) (55,137)
Collection of and proceeds from sale
of finance receivables ........................................... —10,545,425 5,718,130 — 89,771 48,678
Additions to fixed assets excluding
equipment leased to others .................................. (1,516,658) (6,801) (1,523,459) (12,911) (58) (12,969)
Additions to equipment leased to others ................ (144,391) (1,103,390) (1,247,781) (1,229) (9,393) (10,622)
Proceeds from sales of fixed assets excluding
equipment leased to others .................................. 81,950 7,628 89,578 697 65 762
Proceeds from sales of equipment
leased to others.................................................... 112,692 297,991 410,683 959 2,537 3,496
Purchases of marketable securities
and security investments....................................... (764,016) (193,280) (957,296) (6,504) (1,645) (8,149)
Proceeds from sales of and maturity of
marketable securities and security investments...... 561,948 129,084 691,032 4,784 1,098 5,882
Payment for additional investments
in affiliated companies, net of cash acquired......... (1,802) — (1,802) (15) — (15)
Changes in investments
and other assets, and other .................................. (3,292) (83,104) (77,606) (28) (707) (661)
Net cash used in investing activities ................ (1,673,569) (1,813,837) (3,375,500) (14,247) (15,441) (28,735)
Cash flows from financing activities
Purchase of common stock..................................... (129,629) — (129,629) (1,104) — (1,104)
Proceeds from issuance of long-term debt .............. 33,904 1,930,823 1,928,788 289 16,437 16,420
Payments of long-term debt ................................... (59,778) (1,233,336) (1,187,506) (509) (10,499) (10,109)
Increase in short-term borrowings .......................... 86,731 513,602 509,826 739 4,372 4,340
Dividends paid........................................................ (244,568) — (244,568) (2,082) — (2,082)
Net cash provided by (used in)
financing activities........................................ (313,340) 1,211,089 876,911 (2,667) 10,310 7,465
Effect of exchange rate changes
on cash and cash equivalents.................................... 58,211 10,532 68,743 495 90 585
Net increase (decrease) in cash and
cash equivalents ....................................................... 93,896 (8,262) 85,634 799 (70) 729
Cash and cash equivalents at beginning of year .......... 1,324,126 159,627 1,483,753 11,272 1,359 12,631
Cash and cash equivalents at end of year .................... ¥ 1,418,022 ¥ 151,365 ¥ 1,569,387 $ 12,071 $ 1,289 $ 13,360
In consolidated statements of cash flows as classified into non-financial services business and financial services business, cash
flows from origination and collection activities of finance receivables relating to inventory-sales are continued to be reported in
investing activities.