Toyota 2006 Annual Report Download - page 4
Download and view the complete annual report
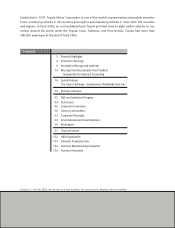
Please find page 4 of the 2006 Toyota annual report below. You can navigate through the pages in the report by either clicking on the pages listed below, or by using the keyword search tool below to find specific information within the annual report.-
 1
1 -
 2
2 -
 3
3 -
 4
4 -
 5
5 -
 6
6 -
 7
7 -
 8
8 -
 9
9 -
 10
10 -
 11
11 -
 12
12 -
 13
13 -
 14
14 -
 15
15 -
16
-
17
-
18
-
19
-
20
-
21
-
22
-
23
-
24
-
25
-
26
-
27
-
28
-
29
-
30
-
31
-
32
-
33
-
34
-
35
-
36
-
37
-
38
-
39
-
40
-
41
-
42
-
43
-
44
-
45
-
46
-
47
-
48
-
49
-
50
-
51
-
52
-
53
-
54
-
55
-
56
-
57
-
58
-
59
-
60
-
61
-
62
-
63
-
64
-
65
-
66
-
67
-
68
-
69
-
70
-
71
-
72
-
73
-
74
-
75
-
76
-
77
-
78
-
79
-
80
-
81
-
82
-
83
-
84
-
85
-
86
-
87
-
88
-
89
-
90
-
91
-
92
-
93
-
94
-
95
-
96
-
97
-
98
-
99
-
100
-
101
-
102
-
103
-
104
-
105
-
106
-
107
-
108
-
109
-
110
-
111
-
112
-
113
-
114
-
115
-
116
-
117
-
118
-
119
-
120
-
121
-
122
-
123
-
124
-
125
-
126
-
127
-
128
-
129
-
130
-
131
-
132
-
133
-
134
-
135
-
136
-
137
-
138
-
139
-
140
 |
 |

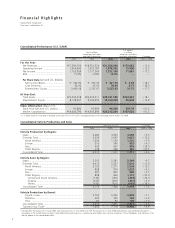
Financial Highlights
Toyota Motor Corporation
Fiscal years ended March 31
2
U.S. dollars*
Yen in millions in millions
except per share data
except per share data
and stock information
and stock information
% change
2004 2005 2006 2006 2005 vs 2006
For the Year:
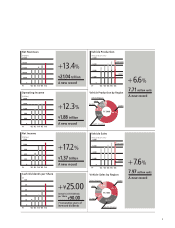
Net Revenues ...................................... ¥17,294,760 ¥18,551,526 ¥21,036,909 $179,083 +13.4
Operating Income .............................. 1,666,890 1,672,187 1,878,342 15,990 +12.3
Net Income......................................... 1,162,098 1,171,260 1,372,180 11,681 +17.2
ROE .................................................... 15.2% 13.6% 14.0% — —
Per Share Data
(yen and U.S. dollars)
:
Net Income (Basic)........................... ¥ 342.90 ¥ 355.35 ¥421.76 $ 3.59 +18.7
Cash Dividends ............................... 45.00 65.00 90.00 0.77 +38.5
Shareholders’ Equity ........................ 2,456.08 2,767.67 3,257.63 27.73 +17.7
At Year-End:
Total Assets ........................................ ¥22,040,228 ¥24,335,011 ¥28,731,595 $244,587 +18.1
Shareholders’ Equity ........................... 8,178,567 9,044,950 10,560,449 89,899 +16.8
Stock Information (March 31):
Stock Price (yen and U.S. dollars)......... ¥3,880 ¥3,990 ¥6,430 $54.74 +61.2
Market Capitalization .......................... ¥14,006,790 ¥14,403,890 ¥23,212,284 $197,602 +61.2
* U.S. dollar amounts have been translated at the rate of ¥117.47=US$1, the approximate current exchange rate at March 31, 2006.
Consolidated Vehicle Production and Sales
Consolidated Performance (U.S. GAAP)
Thousands of units % change
2004 2005 2006 2005 vs 2006
Vehicle Production by Region:
Japan ........................................................................... 4,284 4,534 4,684 +3.3
Overseas Total .............................................................. 2,229 2,697 3,027 +12.2
North America .......................................................... 1,034 1,156 1,201 +3.9
Europe...................................................................... 515 596 623 +4.5
Asia .......................................................................... 402 647 836 +29.0
Other Regions........................................................... 278 298 367 +23.3
Consolidated Total ....................................................... 6,513 7,231 7,711 +6.6
Vehicle Sales by Region:
Japan ........................................................................... 2,303 2,381 2,364 –0.7
Overseas Total .............................................................. 4,416 5,027 5,610 +11.6
North America .......................................................... 2,103 2,271 2,556 +12.5
Europe...................................................................... 898 979 1,023 +4.5
Asia .......................................................................... 557 833 880 +5.7
Other Regions........................................................... 858 944 1,151 +22.0
Central and South America.................................... [146] [185] [233] +26.0
Oceania ................................................................ [236] [239] [251] +5.0
Others................................................................... [476] [520] [667] +28.4
Consolidated Total ....................................................... 6,719 7,408 7,974 +7.6
Vehicle Production by Brand:
Toyota / Lexus ........................................................... 5,763 6,393 6,848 +7.1
Daihatsu ................................................................... 663 745 763 +2.4
Hino ......................................................................... 87 93 100 +7.0
Consolidated Total ....................................................... 6,513 7,231 7,711 +6.6
Toyota Group Total* .................................................... 7,050 7,719 8,460 +9.6
* Includes 537 thousand units in fiscal 2004, 488 thousand units in fiscal 2005, and 749 thousand units in fiscal 2006 produced by unconsolidated companies—
principally in the United States (at New United Motor Manufacturing, Inc., a Toyota-General Motors joint venture company), China, Philippines, and Malaysia—that
do not appear in the consolidated totals.