APC 2006 Annual Report Download - page 10
Download and view the complete annual report
Please find page 10 of the 2006 APC annual report below. You can navigate through the pages in the report by either clicking on the pages listed below, or by using the keyword search tool below to find specific information within the annual report.-
 1
1 -
 2
2 -
 3
3 -
 4
4 -
 5
5 -
 6
6 -
 7
7 -
 8
8 -
 9
9 -
 10
10 -
 11
11 -
 12
12 -
 13
13 -
 14
14 -
 15
15 -
 16
16 -
 17
17 -
 18
18 -
 19
19 -
 20
20 -
 21
21 -
22
-
23
-
24
-
25
-
26
-
27
-
28
-
29
-
30
-
31
-
32
-
33
-
34
-
35
-
36
-
37
-
38
-
39
-
40
-
41
-
42
-
43
-
44
-
45
-
46
-
47
-
48
-
49
-
50
-
51
-
52
-
53
-
54
-
55
-
56
-
57
-
58
-
59
-
60
-
61
-
62
-
63
-
64
-
65
-
66
-
67
-
68
-
69
-
70
-
71
-
72
-
73
-
74
-
75
-
76
-
77
-
78
-
79
-
80
-
81
-
82
-
83
-
84
-
85
-
86
-
87
-
88
-
89
-
90
-
91
-
92
-
93
-
94
-
95
-
96
-
97
-
98
-
99
-
100
-
101
-
102
-
103
-
104
-
105
-
106
-
107
-
108
-
109
-
110
-
111
-
112
-
113
-
114
-
115
-
116
-
117
-
118
-
119
-
120
-
121
-
122
-
123
-
124
-
125
-
126
-
127
-
128
-
129
-
130
-
131
-
132
-
133
-
134
-
135
-
136
-
137
-
138
-
139
-
140
-
141
-
142
-
143
-
144
-
145
-
146
-
147
-
148
-
149
-
150
-
151
-
152
-
153
-
154
-
155
-
156
-
157
-
158
-
159
-
160
-
161
-
162
-
163
-
164
-
165
-
166
-
167
-
168
-
169
-
170
-
171
-
172
-
173
-
174
-
175
-
176
-
177
-
178
-
179
-
180
-
181
-
182
-
183
-
184
-
185
-
186
-
187
-
188
-
189
-
190
-
191
-
192
-
193
-
194
-
195
-
196
 |
 |

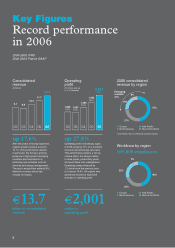
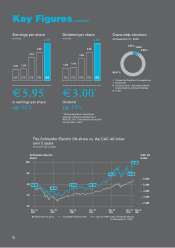
Key Figures
Record performance
in 2006
Consolidated
revenue
(billion)
02
9.1
47%
46%
Europe Asia-Pacific
North America Rest of the World
*Asia-Pacific, Rest of the World, Eastern Europe.
Europe Asia-Pacific
North America Rest of the World
27%
25%
22%
7%
03
8.8
04
10.3
05
11.7
06
13.7
02
1,040
11.5%
03
1,007
11.5%
04
1,286
12.4%
05
1,565
13.4%
06
2,001
14.6%
13.7
billion in consolidated
revenue
up 17.6%
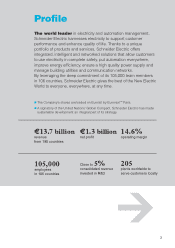
After two years of strong expansion,
organic growth reached a record
10.7%. This performance reflects,
in particular, the Group's growing
presence in high-growth emerging
countries and investments in
promising new activities such as
services and energy management.
The year's acquisitions added 6.9%,
while the currency effect had
virtually no impact.
Operating
profit
(million and as
a % of revenue)
2006 consolidated
revenue by region
2,001
million in
operating profit
up 27.8%
Operating profit rose sharply again
in 2006, growing 21% on a constant
structure and exchange rate basis.
This performance reflects a strong
volume effect, the Group’s ability
to raise prices, productivity gains
and good base cost management.
Operating margin widened by
1.2 points from the previous year
to a record 14.6%. All regions and
operations showed a significant
increase in operating profit.
2004-2006: IFRS
2002-2003: French GAAP
Workforce by region
105,000 employees
18%
8%
Emerging
markets*
31%
8