APC 2006 Annual Report Download - page 79
Download and view the complete annual report
Please find page 79 of the 2006 APC annual report below. You can navigate through the pages in the report by either clicking on the pages listed below, or by using the keyword search tool below to find specific information within the annual report.-
 1
1 -
2
-
3
-
4
-
5
-
6
-
7
-
8
-
9
-
10
-
11
-
12
-
13
-
14
-
15
-
16
-
17
-
18
-
19
-
20
-
21
-
22
-
23
-
24
-
25
-
26
-
27
-
28
-
29
-
30
-
31
-
32
-
33
-
34
-
35
-
36
-
37
-
38
-
39
-
40
-
41
-
42
-
43
-
44
-
45
-
46
-
47
-
48
-
49
-
50
-
51
-
52
-
53
-
54
-
55
-
56
-
57
-
58
-
59
-
60
-
61
-
62
-
63
-
64
-
65
-
66
-
67
-
68
-
 69
69 -
 70
70 -
 71
71 -
 72
72 -
 73
73 -
 74
74 -
 75
75 -
 76
76 -
 77
77 -
 78
78 -
 79
79 -
 80
80 -
 81
81 -
 82
82 -
 83
83 -
 84
84 -
 85
85 -
 86
86 -
 87
87 -
 88
88 -
 89
89 -
90
-
91
-
92
-
93
-
94
-
95
-
96
-
97
-
98
-
99
-
100
-
101
-
102
-
103
-
104
-
105
-
106
-
107
-
108
-
109
-
110
-
111
-
112
-
113
-
114
-
115
-
116
-
117
-
118
-
119
-
120
-
121
-
122
-
123
-
124
-
125
-
126
-
127
-
128
-
129
-
130
-
131
-
132
-
133
-
134
-
135
-
136
-
137
-
138
-
139
-
140
-
141
-
142
-
143
-
144
-
145
-
146
-
147
-
148
-
149
-
150
-
151
-
152
-
153
-
154
-
155
-
156
-
157
-
158
-
159
-
160
-
161
-
162
-
163
-
164
-
165
-
166
-
167
-
168
-
169
-
170
-
171
-
172
-
173
-
174
-
175
-
176
-
177
-
178
-
179
-
180
-
181
-
182
-
183
-
184
-
185
-
186
-
187
-
188
-
189
-
190
-
191
-
192
-
193
-
194
-
195
-
196
 |
 |
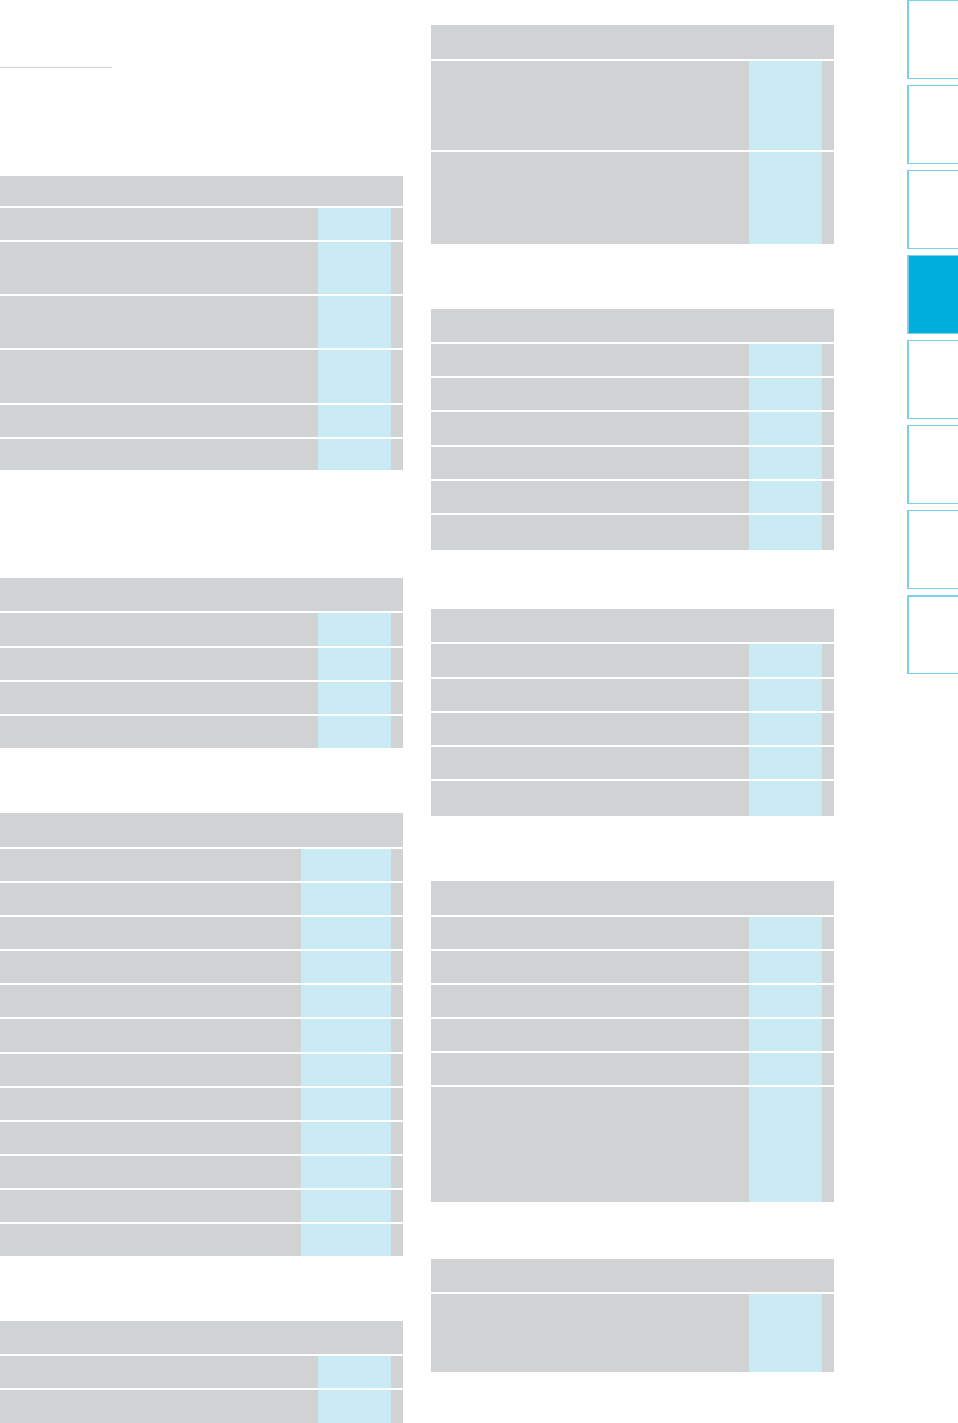
77
4
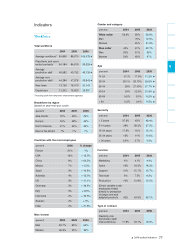
Age
(percent)
2004 2005 2006
14-24 8.1% 11.9% 11.2%
25-34 29.1% 28.10% 29.6%
35-44 29% 27.40% 27.7%
45-54 24% 22.9% 21.8%
55-64 9.6% 9.3% 9.2%
> 64 0.2% 0.4% 0.5%
Seniority
(percent)
2004 2005 2006
< 5 years 37.6% 42% 43.4%
5-14 years 29% 28.3% 27.5%
15-24 years 17.6% 16% 15.1%
25-34 years 13% 11% 10.6%
> 34 years 2.8% 2.7% 3.4%
Function
(percent)
2004 2005 2006
Marketing 4% 4.1% 4.4%
Sales 16% 18.3% 18.3%
Support 21% 15.7% 15.7%
Technical 6% 7.5% 8.3%
Production 10% 10.8% 10.2%
(Direct variable costs -
employees linked
directly to production
of range core and
adapted products 43% 43.6% 43.1%
Type of contract
(percent)
2004 2005 2006
Flexibility rate
(temporary staff/
total workforce) 17.9% 18.1% 19.5%
Indicators
Workforce
Total workforce
2004 2005 2006
Average workforce* 84,866 88,670 100,078
Fixed-term and open-
ended contracts 84,184 84,819 96,529
Average
production staff 40,582 40,792 46,135
Average non-
production staff 44,284 47,878 53,943
New hires 13,726 16,070 31,141
Departures 12,342 15,820 23,387
* Including staff from temporary employment agencies.
Breakdown by region
(based on year-end spot count)
(percent)
2004 2005 2006
Asia-Pacific 18% 20% 22%
Europe 54% 49% 46%
North America 21% 24% 25%
Rest of the World 7% 7% 7%
Gender and category
(percent)
2004 2005 2006
White collar 56.6% 59% 56.9%
Men - 75% 72.5%
Women - 25% 27.5%
Blue collar 43% 41% 43.1%
Men 50% 51% 53%
Women 50% 49% 47%
Men / women
(percent)
2004 2005 2006
Men 63.7% 65% 64%
Women 36.3% 35% 36%
Countries with the most employees
(percent)
2006 % change
France 21% -1%
USA 16% + 12.5%
China 9% + 60.2%
Mexico 7% + 6.2%
Spain 4% + 10.8%
Australia 4% + 12.5%
UK 3% + 11.1%
Germany 3% + 36.4%
Italy 3% + 8.5%
Indonesia 2% + 32.5%
Sweden 2% + 6%
India 2% + 27.8%
2006 audited indicators