APC 2006 Annual Report Download - page 72
Download and view the complete annual report
Please find page 72 of the 2006 APC annual report below. You can navigate through the pages in the report by either clicking on the pages listed below, or by using the keyword search tool below to find specific information within the annual report.-
 1
1 -
2
-
3
-
4
-
5
-
6
-
7
-
8
-
9
-
10
-
11
-
12
-
13
-
14
-
15
-
16
-
17
-
18
-
19
-
20
-
21
-
22
-
23
-
24
-
25
-
26
-
27
-
28
-
29
-
30
-
31
-
32
-
33
-
34
-
35
-
36
-
37
-
38
-
39
-
40
-
41
-
42
-
43
-
44
-
45
-
46
-
47
-
48
-
49
-
50
-
51
-
52
-
53
-
54
-
55
-
56
-
57
-
58
-
59
-
60
-
61
-
 62
62 -
 63
63 -
 64
64 -
 65
65 -
 66
66 -
 67
67 -
 68
68 -
 69
69 -
 70
70 -
 71
71 -
 72
72 -
 73
73 -
 74
74 -
 75
75 -
 76
76 -
 77
77 -
 78
78 -
 79
79 -
 80
80 -
 81
81 -
 82
82 -
83
-
84
-
85
-
86
-
87
-
88
-
89
-
90
-
91
-
92
-
93
-
94
-
95
-
96
-
97
-
98
-
99
-
100
-
101
-
102
-
103
-
104
-
105
-
106
-
107
-
108
-
109
-
110
-
111
-
112
-
113
-
114
-
115
-
116
-
117
-
118
-
119
-
120
-
121
-
122
-
123
-
124
-
125
-
126
-
127
-
128
-
129
-
130
-
131
-
132
-
133
-
134
-
135
-
136
-
137
-
138
-
139
-
140
-
141
-
142
-
143
-
144
-
145
-
146
-
147
-
148
-
149
-
150
-
151
-
152
-
153
-
154
-
155
-
156
-
157
-
158
-
159
-
160
-
161
-
162
-
163
-
164
-
165
-
166
-
167
-
168
-
169
-
170
-
171
-
172
-
173
-
174
-
175
-
176
-
177
-
178
-
179
-
180
-
181
-
182
-
183
-
184
-
185
-
186
-
187
-
188
-
189
-
190
-
191
-
192
-
193
-
194
-
195
-
196
 |
 |

In addition, provisions in an amount of 38 million
were set aside to cover delays and difficulties in
deploying information systems.
The Group recorded gains of 46 million on the dis-
posal of property assets in 2006, notably with the sale
of the historic Telemecanique site in the Paris area.
At December 31, 2006, capitalization of development
costs had a positive net impact on operating profit of
98 million, virtually the same as in 2005 (100 mil-
lion).
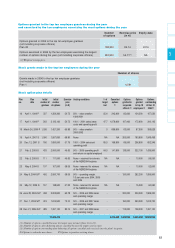
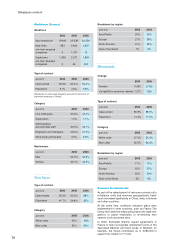
Breakdown by region
Operating margin in Europe rose by 1.9 point during
the year to 15.4% at December 31, 2006.
North America reported an operating margin of 14.0%
at year-end, up 0.7 point from December 31, 2005.
Operating margin in the Asia-Pacific region improved
by 0.1 point to end the year at 13.0%.
Operating margin in the Rest of the World came to
15.5% compared to 14.0% in 2005.
Breakdown by business
Operating margin in the Electrical Distribution busi-
ness widened by 1.4 point to 15.3%. Changes in the
scope of consolidation and exchange rates had no
impact on operating margin rate.
The Automation & Control business achieved an oper-
ating margin of 13.5%, up 0.9 point from 2005. On a
constant structure and currency basis, operating mar-
gin would have been 13.6%.
Operating margin in the Critical Power business
reached 12.9% in 2006, an increase from 0.8 point
from 2005.
Finance costs and other
financial income and expense, net
Finance costs and other financial income and
expense, net totaled a negative 121 million com-
pared with a negative 105 million in 2005.
Net finance costs amounted to 104 million, virtually
unchanged from the 103 million recorded in 2005.
The cost of increased average net borrowings (1,700
million in 2006 versus 1,070 million in 2005) was off-
set by a better return on invested cash and the modifi-
cation of financing solutions.
Exchange rate fluctuations and their impact on curren-
cy hedging positions added 15 million to financial
expense.
Lastly, changes in the fair value of financial instru-
ments did not have any impact in 2006.
Income tax
The effective tax rate stood at 28.5% compared with
29.1% at December 31, 2005.
Share of profit/(losses) of associates
The Group’s share of profits of associates came to 2
million at December 31, 2006.
The year-earlier figure primarily reflected the results of
Clipsal Asia, which has been fully consolidated since
January 1, 2006.
Minority interests
Minority interests totaled 37 million in 2006. Minority
interests mainly correspond to the share of income
attributable to minority shareholders of Clipsal Asia,
MGE-UPS, Feller AG, EPS Ltd, and a number of Chi-
nese companies.
Profit attributable to
equity holders of the parent
Profit attributable to equity holders of the parent grew
31.7% to 1,309 million.
Earnings per share
The 30.5% increase from 4.56 to 5.95 reflects
growth in profit for the period.
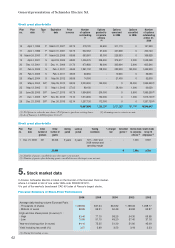
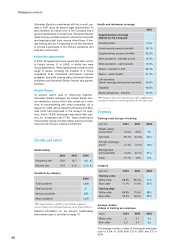
3. Change in
financial situation
Balance sheet and cash flow
statement items
Total assets stood at 18,964 million at December 31,
2006, up 14.1% from the previous year-end. Non cur-
rent assets amounted to 10,413 million and repre-
sented 54.9% of total assets, an increase of 1.8% from
2005.
Goodwill
Goodwill rose by 307 million over the period to
6,186 million, or 32.6% of total assets.
Acquisitions in 2006 added 728 million.
The provisional accounting for the BEI Technologies
business combination was adjusted, leading in 2006 to
the recognition of amortizable intangible assets in an
amount of 72 million net of deferred taxes, which was
deducted from the goodwill recognized in 2005.
The currency effect reduced total goodwill by 324
million.
Impairment tests conducted at the end of the year did
not reveal any material losses.
Business review
70