APC 2006 Annual Report Download - page 73
Download and view the complete annual report
Please find page 73 of the 2006 APC annual report below. You can navigate through the pages in the report by either clicking on the pages listed below, or by using the keyword search tool below to find specific information within the annual report.-
 1
1 -
2
-
3
-
4
-
5
-
6
-
7
-
8
-
9
-
10
-
11
-
12
-
13
-
14
-
15
-
16
-
17
-
18
-
19
-
20
-
21
-
22
-
23
-
24
-
25
-
26
-
27
-
28
-
29
-
30
-
31
-
32
-
33
-
34
-
35
-
36
-
37
-
38
-
39
-
40
-
41
-
42
-
43
-
44
-
45
-
46
-
47
-
48
-
49
-
50
-
51
-
52
-
53
-
54
-
55
-
56
-
57
-
58
-
59
-
60
-
61
-
62
-
 63
63 -
 64
64 -
 65
65 -
 66
66 -
 67
67 -
 68
68 -
 69
69 -
 70
70 -
 71
71 -
 72
72 -
 73
73 -
 74
74 -
 75
75 -
 76
76 -
 77
77 -
 78
78 -
 79
79 -
 80
80 -
 81
81 -
 82
82 -
 83
83 -
84
-
85
-
86
-
87
-
88
-
89
-
90
-
91
-
92
-
93
-
94
-
95
-
96
-
97
-
98
-
99
-
100
-
101
-
102
-
103
-
104
-
105
-
106
-
107
-
108
-
109
-
110
-
111
-
112
-
113
-
114
-
115
-
116
-
117
-
118
-
119
-
120
-
121
-
122
-
123
-
124
-
125
-
126
-
127
-
128
-
129
-
130
-
131
-
132
-
133
-
134
-
135
-
136
-
137
-
138
-
139
-
140
-
141
-
142
-
143
-
144
-
145
-
146
-
147
-
148
-
149
-
150
-
151
-
152
-
153
-
154
-
155
-
156
-
157
-
158
-
159
-
160
-
161
-
162
-
163
-
164
-
165
-
166
-
167
-
168
-
169
-
170
-
171
-
172
-
173
-
174
-
175
-
176
-
177
-
178
-
179
-
180
-
181
-
182
-
183
-
184
-
185
-
186
-
187
-
188
-
189
-
190
-
191
-
192
-
193
-
194
-
195
-
196
 |
 |
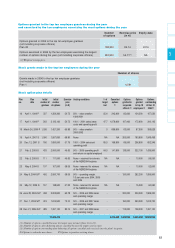
Property, plant and equipment
and intangible assets
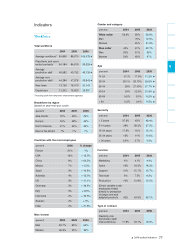
Property, plant and equipment and intangible assets
came to 3,115 million, or 16.4% of total assets, up
7.2% from the year before.
Intangible assets
Trademarks rose by 20 million over the year to 760
million. Acquisitions added 46 million (of which 35
million for the BEI trademark), while the negative cur-
rency effect reduced the total by 27 million.
Gross capitalized development costs totaled 315 mil-
lion (264 million net), reflecting the capitalization of
costs related to current projects in an amount of 121
million. Other intangible assets, net, primarily compris-
ing software and patents, rose 75 million over the
year. The increase stems from the recognition of cus-
tomer lists and patents in an amount of 67 million fol-
lowing the acquisitions of BEI Technologies, capital-
ized development costs for the global SAP system in
an amount of 52 million, and a negative currency
effect in an amount of 28 million.
Property, plant and equipment
Property, plant and equipment came to 1,615 million
versus 1,601 million the year before. Acquisitions
added 102 million, while the currency effect had a
negative impact of 55 million. Net investments totaled
254 million.
Investments in associates
Investments in associates decreased by 38 million to
10 million following the full consolidation of Clipsal
Asia since January 1, 2006.
Non-current financial assets
Non-current financial assets, primarily equity instru-
ments listed in an active market and loans and receiv-
ables related to investments, totaled 430 million, a
decrease of 167 million from December 31, 2005.
The decrease stemmed from the other non-current
financial assets decline, following the payment of the
177 million balance on the vendor loan granted to the
buyer of Legrand shares. Available-for-sale financial
assets remained stable at 316 million compared to
315 million the year before.
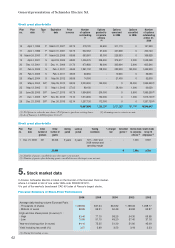
Cash and net debt
Net cash provided by operating activities before
changes in operating assets and liabilities rose 24.1%
to 1,921 million, representing 14.0% of revenue.
Changes in operating working capital represented a
negative 413 million, reflecting strong business
growth over the year. The working capital ratio
increased by 0.2 point to 21.4% from 21.2% the year
before.
Net cash provided by operating activities totaled
1,588 million, up 19.8% from 1,325 million in 2005.
Capital expenditure, which includes capitalized devel-
opment projects, represented an outlay of 481 million
compared with 476 million in 2005. These invest-
ments represented 3.5% of revenue in 2006.
Acquisitions used a total of 898 million, net of the
cash acquired.
Cash proceeds from the sale of treasury stock on
exercise of stock options amounted to 53 million
(the Group bought back Company shares in a net
amount of 73 million in 2005). Dividends paid
totaled 517 million, (of which 15 million to minori-
ty interests) including 9 million for the dividend
equalization tax.
Other payments with a material impact on cash includ-
ed the payment of the 177 million balance on the
vendor loan granted to the buyer of Legrand shares in
2002.
At December 31, 2006, net debt totaled 1,835 mil-
lion or 21.1% of equity attributable to equity holders of
the parent, representing an increase of 73 million
from the year before. Net cash used in investing activ-
ities was almost entirely financed by cash from oper-
ations.
Cash and cash equivalents totaled 2,544 million of
which 735 million in cash, 1,733 million in money
market funds and 76 million in marketable securities,
comprising short-term instruments such as commer-
cial paper, monetary mutual funds and equivalents.
Total current and non-current financial liabilities
amounted to 4,379 million. Of this, bonds represent-
ed 3,688 million, including the issuance of two bonds
in 2006 for 1,000 million and two tranches of a
1,500 million issue in August 2005 as part of the
Group's EMTN program. Lastly, acquisition debt
accounted for 37 million of the total (net of the
amount held in escrow for Clipsal’s acquisition). Cur-
rent financial liabilities totaled 885 million at Decem-
ber 31, 2006 and primarily included bank overdrafts,
accrued interest and the current portion of bonds
(450 million).
Equity
Equity attributable to equity holders of the parent came
to 8,717 million, or 46.0% of the balance sheet total.
The 473 million increase over the year is the net
result of the following:
Payment of the 2005 dividend, in an amount of 493
million.
Profit for the period of 1,309 million.
Shares issued on the exercise of stock options for
61 million.
Changes in treasury stock, which increased equity
by 53 million.
The impact of currency fluctuations, which reduced
the translation reserve by 353 million.
Fair value adjustments to hedging instruments and
available-for-sale financial assets, which decreased
equity by 133 million.
Changes in actuarial gains and losses stemming
from the measurement of employee benefits, which
increased equity by 24 million.
71
4