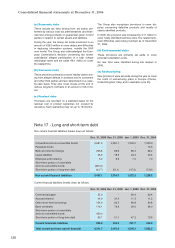
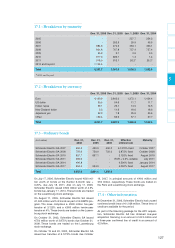
APC 2006 Annual Report Download - page 125
Download and view the complete annual report
Please find page 125 of the 2006 APC annual report below. You can navigate through the pages in the report by either clicking on the pages listed below, or by using the keyword search tool below to find specific information within the annual report.-
 1
1 -
2
-
3
-
4
-
5
-
6
-
7
-
8
-
9
-
10
-
11
-
12
-
13
-
14
-
15
-
16
-
17
-
18
-
19
-
20
-
21
-
22
-
23
-
24
-
25
-
26
-
27
-
28
-
29
-
30
-
31
-
32
-
33
-
34
-
35
-
36
-
37
-
38
-
39
-
40
-
41
-
42
-
43
-
44
-
45
-
46
-
47
-
48
-
49
-
50
-
51
-
52
-
53
-
54
-
55
-
56
-
57
-
58
-
59
-
60
-
61
-
62
-
63
-
64
-
65
-
66
-
67
-
68
-
69
-
70
-
71
-
72
-
73
-
74
-
75
-
76
-
77
-
78
-
79
-
80
-
81
-
82
-
83
-
84
-
85
-
86
-
87
-
88
-
89
-
90
-
91
-
92
-
93
-
94
-
95
-
96
-
97
-
98
-
99
-
100
-
101
-
102
-
103
-
104
-
105
-
106
-
107
-
108
-
109
-
110
-
111
-
112
-
113
-
114
-
 115
115 -
 116
116 -
 117
117 -
 118
118 -
 119
119 -
 120
120 -
 121
121 -
 122
122 -
 123
123 -
 124
124 -
 125
125 -
 126
126 -
 127
127 -
 128
128 -
 129
129 -
 130
130 -
 131
131 -
 132
132 -
 133
133 -
 134
134 -
 135
135 -
136
-
137
-
138
-
139
-
140
-
141
-
142
-
143
-
144
-
145
-
146
-
147
-
148
-
149
-
150
-
151
-
152
-
153
-
154
-
155
-
156
-
157
-
158
-
159
-
160
-
161
-
162
-
163
-
164
-
165
-
166
-
167
-
168
-
169
-
170
-
171
-
172
-
173
-
174
-
175
-
176
-
177
-
178
-
179
-
180
-
181
-
182
-
183
-
184
-
185
-
186
-
187
-
188
-
189
-
190
-
191
-
192
-
193
-
194
-
195
-
196
 |
 |
123
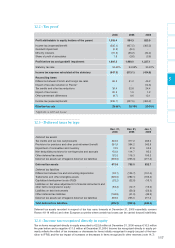
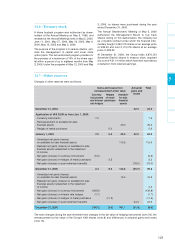
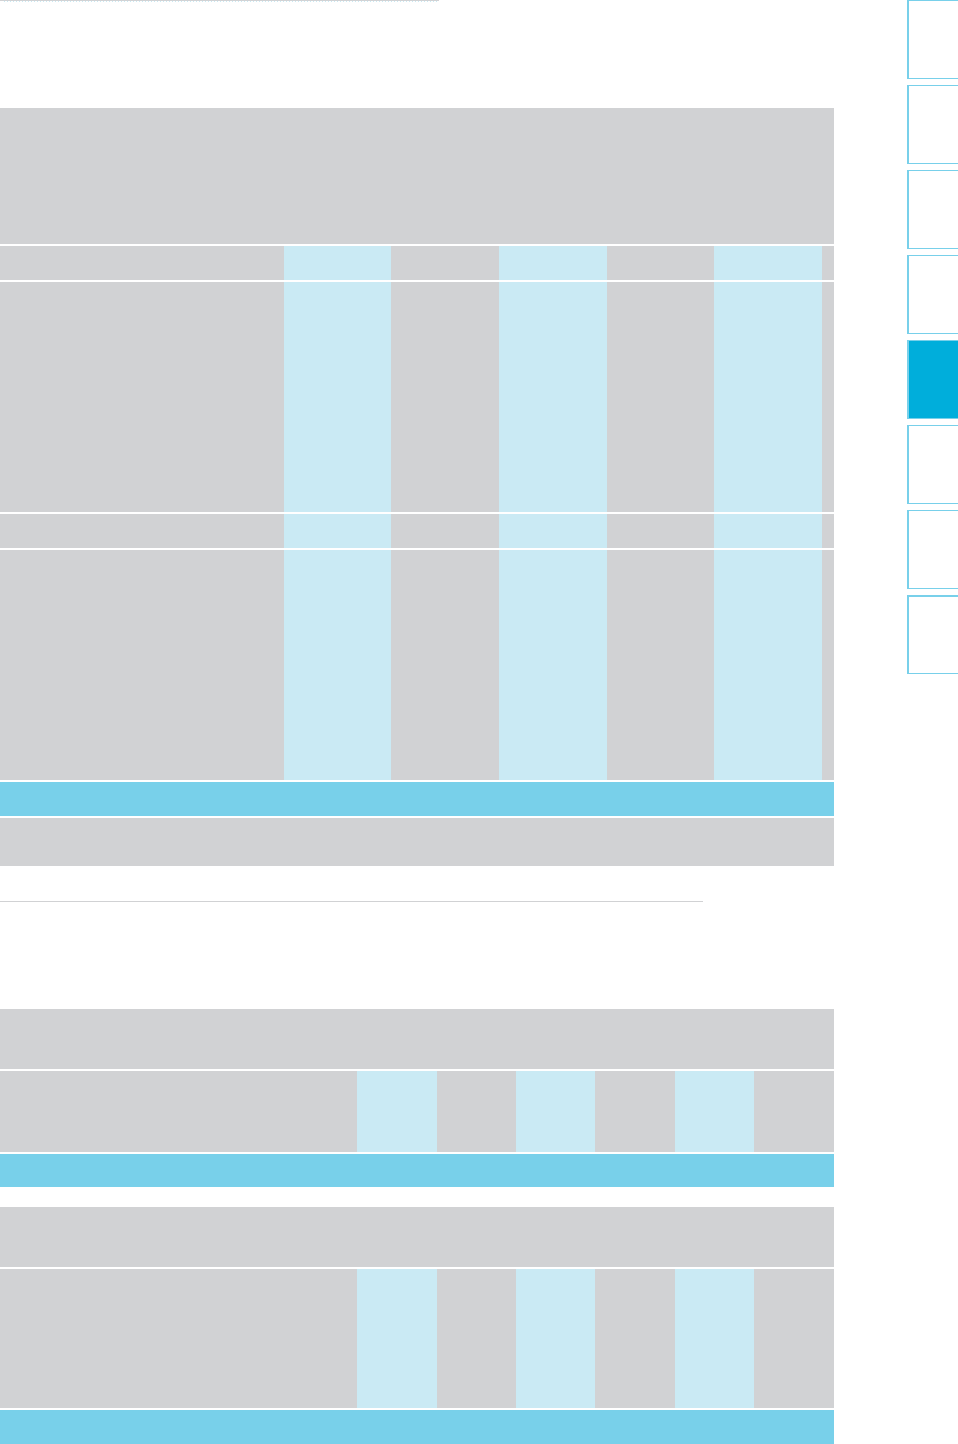
5
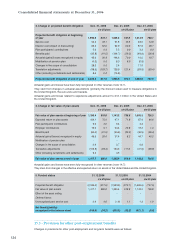
Pensions
Of
Other post-
Of
Provisions
and
which
employment
which
for pensions
termination
US plans
and long-term
US plans
and other post
benefits benefits employment
benefit
obligations
Dec. 31, 2004 521.1
8.8
505.0
418.5
1,026.2
Net cost recognized in
the statement of income 47.9
1.5
22.6
21.9
70.5
Benefits paid (49.1) - (23.5)
(22.4)
(72.6)
Plan participants' contributions (34.4)
(23.6)
- - (34.4)
Actuarial gains and losses
recognized in equity 117.2
61.8
14.9
14.6
132.1
Translation adjustment 5.6
3.8
67.1
65.5
72.7
C
hanges in the scope of consolidation
2.4
0.0
3.0 - 5.4
Other changes (10.7)
(0.1)
4.3 - (6.4)
Dec. 31, 2005 * 600.0
52.2
593.4
498.1
1,193.5
Net cost recognized in
the statement of income 44.3
(4.5)
26.4
23.3
70.7
Benefits paid (32.4)
0.0
(27.2)
(25.6)
(59.6)
Plan participants' contributions (19.6)
(5.1)
- - (19.6)
Actuarial gains and losses
recognized in equity (6.0)
(7.8)
(23.7) - (29.7)
Translation adjustment 7.5
(4.7)
(52.7)
(47.3)
(45.2)
C
hanges in the scope of consolidation
27.9
0.0
(0.7) - 27.2
Other changes (4.9)
0.1
1.4
(3.1)
(3.6)
Dec. 31, 2006 * 616.8
30.2
516.9
445.4
1,133.7
*Including €7 million in pension assets recogonized under "Other receivables" (see note 11) in 2005 and €25.3 million in
pension assets recognized under "Other financial assets" in 2006.
15.1 - Changes in provisions for pensions
and other post-employment benefit obligations
C
hanges in provisions for pensions and other post-employment benefit obligations (net of assets) were as follows:
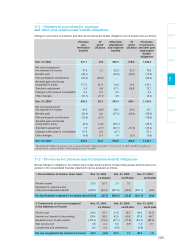
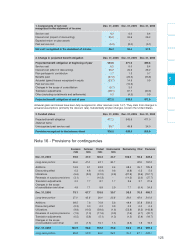
15.2 - Provisions for pensions and termination benefit obligations
Annual changes in obligations, the market value of plan assets and the corresponding assets and provisions rec-
ognized in the consolidated financial statements can be analyzed as follows:
1. Reconciliation of balance sheet items Dec. 31, 2006 Dec. 31, 2005 Dec. 31, 2004
o/w US plans o/w US plans o/w US plans
Pension assets 25.3
25.1
7.0
7.0
Provisions for pensions and
other post-employment benefit (642.1)
(55.3)
(607.0)
(59.2)
(521.1)
(8.8)
Net Asset/(Liability) recognized in the balance sheet
(616.8)
(30.2)
(600.0)
(52.2)
(521.1)
(8.8)
2. Components of net cost recognized Dec. 31, 2006 Dec. 31, 2005 Dec. 31, 2004
in the statement of income
o/w US plans o/w US plans o/w US plans
Service cost 54.2
18.1
51.8
15.9
48.5
14.8
Interest cost (impact of discounting) 93.4
52.0
92.9
50.5
87.9
48.7
Expected return on plan assets (104.1)
(75.0)
(97.1)
(71.8)
(87.4)
(64.6)
Past service cost 0.3
0.4
5.9
6.9
1.2
2.7
Curtailments and settlements 0.5
0.0
(5.6) (0.8)
Net cost recognized in the statement of income
44.3
(4.5)
47.9
1.5
49.4
1.6