APC 2006 Annual Report Download - page 88
Download and view the complete annual report
Please find page 88 of the 2006 APC annual report below. You can navigate through the pages in the report by either clicking on the pages listed below, or by using the keyword search tool below to find specific information within the annual report.-
 1
1 -
2
-
3
-
4
-
5
-
6
-
7
-
8
-
9
-
10
-
11
-
12
-
13
-
14
-
15
-
16
-
17
-
18
-
19
-
20
-
21
-
22
-
23
-
24
-
25
-
26
-
27
-
28
-
29
-
30
-
31
-
32
-
33
-
34
-
35
-
36
-
37
-
38
-
39
-
40
-
41
-
42
-
43
-
44
-
45
-
46
-
47
-
48
-
49
-
50
-
51
-
52
-
53
-
54
-
55
-
56
-
57
-
58
-
59
-
60
-
61
-
62
-
63
-
64
-
65
-
66
-
67
-
68
-
69
-
70
-
71
-
72
-
73
-
74
-
75
-
76
-
77
-
 78
78 -
 79
79 -
 80
80 -
 81
81 -
 82
82 -
 83
83 -
 84
84 -
 85
85 -
 86
86 -
 87
87 -
 88
88 -
 89
89 -
 90
90 -
 91
91 -
 92
92 -
 93
93 -
 94
94 -
 95
95 -
 96
96 -
 97
97 -
 98
98 -
99
-
100
-
101
-
102
-
103
-
104
-
105
-
106
-
107
-
108
-
109
-
110
-
111
-
112
-
113
-
114
-
115
-
116
-
117
-
118
-
119
-
120
-
121
-
122
-
123
-
124
-
125
-
126
-
127
-
128
-
129
-
130
-
131
-
132
-
133
-
134
-
135
-
136
-
137
-
138
-
139
-
140
-
141
-
142
-
143
-
144
-
145
-
146
-
147
-
148
-
149
-
150
-
151
-
152
-
153
-
154
-
155
-
156
-
157
-
158
-
159
-
160
-
161
-
162
-
163
-
164
-
165
-
166
-
167
-
168
-
169
-
170
-
171
-
172
-
173
-
174
-
175
-
176
-
177
-
178
-
179
-
180
-
181
-
182
-
183
-
184
-
185
-
186
-
187
-
188
-
189
-
190
-
191
-
192
-
193
-
194
-
195
-
196
 |
 |

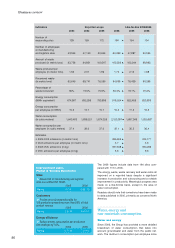
Business review
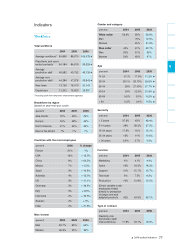
Indicators Reported scope Like-for-like 2005/2006
2003 2004 2005 2006 2005 2006
Number of
responding sites 139 159 172 184 154 154
Number of employees
at manufacturing
and logistics sites 43,944 47,140 50,644 60,462 47,887 50,064
Amount of waste
produced (in metric tons) 93,736 94,821 100,547 105,502 102,244 98,893
Waste produced per
employee (in metric tons) 1.94 2.01 1.99 1.74 2.14 1.98
Recovered waste
(in metric tons) 62,645 69,741 76,286 84,836 78,439 80,286
Percentage of
waste recovered 65% 73.5% 75.9% 80.4% 76.7% 81.2%
Energy consumption
(MWh equivalent) 674,967 692,298 793,898 918,024 822,465 823,856
Energy consumption
per employee (in MWh) 15.3 14.7 15.7 15.2 17.2 16.5
Water consumption
(in cubic meters) 1,643,483 1,838,221 1,874,329 2,122,3811,687,349 1,820,887
Water consumption per
employee (in cubic meters) 37.4 39.0 37.0 35.1 35.2 36.4
Estimates
2006 CO2 emissions (in metric tons) 285,655 244,177
CO2 emissions per employee (in metric tons) 4.7 4.9
2006 VOC emissions (in kg) 337,548 330,299
VOC emissions per employee (in kg) 5.6 6.6
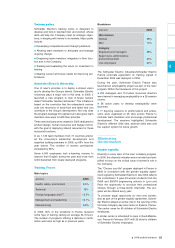
The 2006 figures include data from 184 sites com-
pared with 172 in 2005.
The energy, waste, waste recovery and water ratios all
improved on a reported basis despite a significant
increase in production and outsourcing and a notable
improvement in productivity. Meaningful progress was
made on a like-for-like basis, except in the area of
water consumption.
Readers should note that corrections have been made
to data published in 2005, primarily as concerns North
America.
Water, energy and
raw materials consumption
Water and energy
Since 2006, the Group has provided a more detailed
breakdown of water consumption that takes into
account groundwater and water from the public net-
work. The decline in consumption per employee since
86
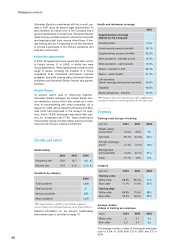
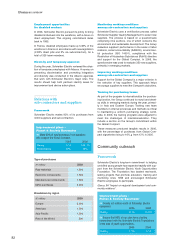
Improvement plans -
Planet & Society Barometer
Sites
Ensure that all manufacturing and logistics
sites are certified ISO 14001.
2005 2006
Rating 5 / 10 6.86 / 10
Customers
Provide an environmental profile for
120 products representing more than 50% of total
product revenue. 2005 2006
Rating 2.3 / 10 5.4 / 10
Energy efficiency
Reduce energy consumption per production
site employee by 10%. 2005 2006
Rating 6.7 / 10 7.5 / 10