APC 2006 Annual Report Download - page 121
Download and view the complete annual report
Please find page 121 of the 2006 APC annual report below. You can navigate through the pages in the report by either clicking on the pages listed below, or by using the keyword search tool below to find specific information within the annual report.-
 1
1 -
2
-
3
-
4
-
5
-
6
-
7
-
8
-
9
-
10
-
11
-
12
-
13
-
14
-
15
-
16
-
17
-
18
-
19
-
20
-
21
-
22
-
23
-
24
-
25
-
26
-
27
-
28
-
29
-
30
-
31
-
32
-
33
-
34
-
35
-
36
-
37
-
38
-
39
-
40
-
41
-
42
-
43
-
44
-
45
-
46
-
47
-
48
-
49
-
50
-
51
-
52
-
53
-
54
-
55
-
56
-
57
-
58
-
59
-
60
-
61
-
62
-
63
-
64
-
65
-
66
-
67
-
68
-
69
-
70
-
71
-
72
-
73
-
74
-
75
-
76
-
77
-
78
-
79
-
80
-
81
-
82
-
83
-
84
-
85
-
86
-
87
-
88
-
89
-
90
-
91
-
92
-
93
-
94
-
95
-
96
-
97
-
98
-
99
-
100
-
101
-
102
-
103
-
104
-
105
-
106
-
107
-
108
-
109
-
110
-
 111
111 -
 112
112 -
 113
113 -
 114
114 -
 115
115 -
 116
116 -
 117
117 -
 118
118 -
 119
119 -
 120
120 -
 121
121 -
 122
122 -
 123
123 -
 124
124 -
 125
125 -
 126
126 -
 127
127 -
 128
128 -
 129
129 -
 130
130 -
 131
131 -
132
-
133
-
134
-
135
-
136
-
137
-
138
-
139
-
140
-
141
-
142
-
143
-
144
-
145
-
146
-
147
-
148
-
149
-
150
-
151
-
152
-
153
-
154
-
155
-
156
-
157
-
158
-
159
-
160
-
161
-
162
-
163
-
164
-
165
-
166
-
167
-
168
-
169
-
170
-
171
-
172
-
173
-
174
-
175
-
176
-
177
-
178
-
179
-
180
-
181
-
182
-
183
-
184
-
185
-
186
-
187
-
188
-
189
-
190
-
191
-
192
-
193
-
194
-
195
-
196
 |
 |

119
5
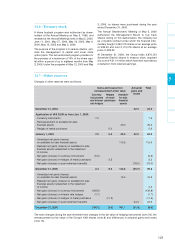
Dec. 31, 2006 Dec. 31, 2005 Dec. 31, 2004
(in millions of shares)
Basic Diluted Basic Diluted Basic Diluted
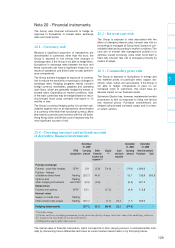
Common shares* 220.003 220.003 218.206 218.206 220.923 220.923
Stock options - 2.094 - 0.708 - 0.334
Average weighted number of shares
220.003 222.097 218.206 218.914 220.923 221.257
*Net of treasury stock and intragroup cross shareholdings.
Earnings per share
Dec. 31, 2006 Dec. 31, 2005 Dec. 31, 2004
(in euros)
Basic Diluted Basic Diluted Basic Diluted
Profit before tax 8.55 8.47 6.68 6.66 5.54 5.53
Earnings per share 5.95 5.90 4.56 4.54 3.73 3.72
14.3 - Earnings per share
Determination of the share base used in calculation
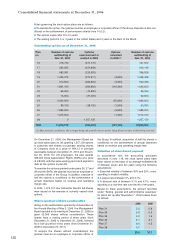
14.4 - Dividends
In 2005, the Group paid out the 2004 dividend of 1.80 per share, for a total of 395.4 million. In 2006, the Group
paid out the 2005 dividend of 2.25 per share, for a total of 493.0 million. In addition, a
précompte
withholding
tax back payment in an amount of 8.7 million was recognized in the consolidated financial statements.
At the Annual Meeting of April 26, 2007, shareholders will be asked to approve a dividend of 3.0 per share for
2006. At December 31, 2006, Schneider Electric SA had distributable reserves in an amount of 275 million (ver-
sus 323 million at the previous year-end), not including profit for the year.
14.5 - Share-based payment
Current stock option plans
The Board of Directors of Schneider Electric SA and later the Management Board have set up stock option plans
for senior executives and certain employees. The main features of these plans were as follows at December
31, 2006:
Plan Date Type Starting Expiration Price Number Options
no. of board
(1)
date of date (in euros) of options cancelled
meeting exercise initially because targets
period granted not met
16 1-Apr-99 P 1-Apr-02 31-Mar-07 50.73 1,259,300 245,900
17 1-Apr-99 P 1-Apr-02 31-Mar-07 50.73 2,123,100 1,078,600
18 24-Mar-00 P 24-Mar-03 23-Mar-08 65.88 1,421,200 686,600
19 4-Apr-01 S 4-Apr-05 3-Apr-09 68.80 1,557,850 NA (2)
20 12-Dec-01 S 12-Dec-05 11-Dec-09 51.76 1,600,000 166,800
21 5-Feb-03 S 5-Feb-07 4-Feb-11 45.65 2,000,000 141,900
22 5-Feb-03 S 5-Jun-03 4-Feb-11 45.65 111,000 NA (2)
23 6-May-04 S 1-Oct-04 5-May-12 56.09 107,000 NA (2)
24 6-May-04 S or P 6-May-08 5-May-12 56.09 2,060,700 -
25 12-May-05 S 1-Oct-05 11-May-13 57.02 138,500 NA (2)
26 28-Jun-05 S or P 28-Jun-09 27-Jun-13 60.78 2,003,800 -
27 1-Dec-05 S or P 1-Dec-09 30-Nov-13 72.1 1,614,900 -
28 21-Dec-06 S or P 21-Dec-10 20-Dec-16 84.12 1,257,120 -
Total 17,254,470 2,319,800
(1) S = Options to subscribe new shares. P = Options to purchase existing shares.
(2) Not applicable because no criteria for exercise were set.