APC 2006 Annual Report Download - page 132
Download and view the complete annual report
Please find page 132 of the 2006 APC annual report below. You can navigate through the pages in the report by either clicking on the pages listed below, or by using the keyword search tool below to find specific information within the annual report.-
 1
1 -
2
-
3
-
4
-
5
-
6
-
7
-
8
-
9
-
10
-
11
-
12
-
13
-
14
-
15
-
16
-
17
-
18
-
19
-
20
-
21
-
22
-
23
-
24
-
25
-
26
-
27
-
28
-
29
-
30
-
31
-
32
-
33
-
34
-
35
-
36
-
37
-
38
-
39
-
40
-
41
-
42
-
43
-
44
-
45
-
46
-
47
-
48
-
49
-
50
-
51
-
52
-
53
-
54
-
55
-
56
-
57
-
58
-
59
-
60
-
61
-
62
-
63
-
64
-
65
-
66
-
67
-
68
-
69
-
70
-
71
-
72
-
73
-
74
-
75
-
76
-
77
-
78
-
79
-
80
-
81
-
82
-
83
-
84
-
85
-
86
-
87
-
88
-
89
-
90
-
91
-
92
-
93
-
94
-
95
-
96
-
97
-
98
-
99
-
100
-
101
-
102
-
103
-
104
-
105
-
106
-
107
-
108
-
109
-
110
-
111
-
112
-
113
-
114
-
115
-
116
-
117
-
118
-
119
-
120
-
121
-
 122
122 -
 123
123 -
 124
124 -
 125
125 -
 126
126 -
 127
127 -
 128
128 -
 129
129 -
 130
130 -
 131
131 -
 132
132 -
 133
133 -
 134
134 -
 135
135 -
 136
136 -
 137
137 -
 138
138 -
 139
139 -
 140
140 -
 141
141 -
 142
142 -
143
-
144
-
145
-
146
-
147
-
148
-
149
-
150
-
151
-
152
-
153
-
154
-
155
-
156
-
157
-
158
-
159
-
160
-
161
-
162
-
163
-
164
-
165
-
166
-
167
-
168
-
169
-
170
-
171
-
172
-
173
-
174
-
175
-
176
-
177
-
178
-
179
-
180
-
181
-
182
-
183
-
184
-
185
-
186
-
187
-
188
-
189
-
190
-
191
-
192
-
193
-
194
-
195
-
196
 |
 |

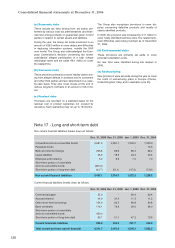
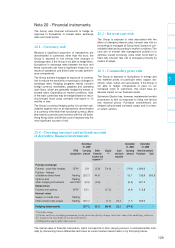
20.5 - Carrying amount and fair value
of financial instruments other than derivatives
December 31, 2006 December 31, 2005
Notional Fair value Notional Fair value
amount (1) amount (1)
Available-for-sale financial assets 315.7 315.7 315.4 315.4
Other non-current financial assets 114.2 114.2 281.4 281.4
Marketable securities 1,733.3 1,733.3 754.8 754.8
Bonds (3,687.9) (3,626.4) (2,691.1) (2,729.2)
Other short and long-term debt
(653.8) (653.8) (316.5) (316.5)
Financial instruments excluding derivatives (2,178.5) (2,117.0) (1,656.0) (1,694.1)
(1) The notional amount corresponds to either amortized cost or fair value.
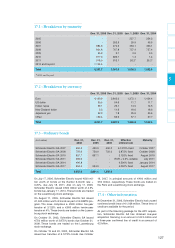
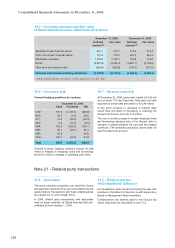
20.6 - Currency risk
Forward hedging positions by currency
Forward currency hedging positions include 1,098
million in hedges of intragroup loans and borrowings
and 131 million in hedges of operating cash flows.
December 31, 2006
Sales Purchases Net
USD 181.5 (1,145.3) (963.8)
AUD 32.2 (4.2) 28.0
JPY 10.2 (34.5) (24.3)
AED 3.3 (11.3) (8.0)
DKK 122.5 (253.2) (130.7)
GBP 65.1 (29.7) 35.4
HKD 44.9 - 44.9
Other 104.1 (52.3) 51.8
Total 563.8 (1,530.5) (966.7)
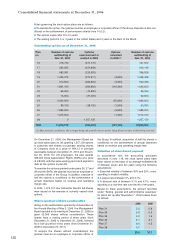
20.7 - Interest rate risk
At December 31, 2006, gross debt totaled 4,342 mil-
lion, of which 77% was fixed rate. Total cash and cash
equivalents at that date amounted to 2,544 million.
A one point increase or decrease in interest rates
would have the effect of increasing or reducing the
Group’s net finance costs by 15 million.
The use of currency swaps to hedge intragroup loans
and borrowings exposes part of the Group’s debt to
changes in spread between the euro and the hedged
currencies. The sensitivity calculation above does not
take this effect into account.
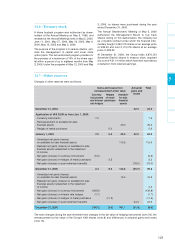
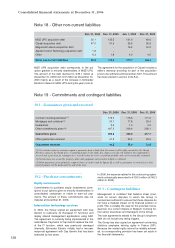
Note 21 - Related party transactions
21.1 - Associates
These are primarily companies over which the Group
has significant influence.They are accounted for by the
equity method. Transactions with these related parties
are carried out on arm’s length terms.
In 2006, related party transactions with associates
were no longer material, as Clipsal Asia was fully con-
solidated as from January 1, 2006.
21.2 - Related parties
with significant influence
No transactions were carried out during the year with
members of the Board of Directors or with Supervisory
Board or Management Board members.
Compensation and benefits paid to the Group’s top
senior executives are described in note 27.3.
Consolidated financial statements at December 31, 2006
130