APC 2006 Annual Report Download - page 82
Download and view the complete annual report
Please find page 82 of the 2006 APC annual report below. You can navigate through the pages in the report by either clicking on the pages listed below, or by using the keyword search tool below to find specific information within the annual report.-
 1
1 -
2
-
3
-
4
-
5
-
6
-
7
-
8
-
9
-
10
-
11
-
12
-
13
-
14
-
15
-
16
-
17
-
18
-
19
-
20
-
21
-
22
-
23
-
24
-
25
-
26
-
27
-
28
-
29
-
30
-
31
-
32
-
33
-
34
-
35
-
36
-
37
-
38
-
39
-
40
-
41
-
42
-
43
-
44
-
45
-
46
-
47
-
48
-
49
-
50
-
51
-
52
-
53
-
54
-
55
-
56
-
57
-
58
-
59
-
60
-
61
-
62
-
63
-
64
-
65
-
66
-
67
-
68
-
69
-
70
-
71
-
 72
72 -
 73
73 -
 74
74 -
 75
75 -
 76
76 -
 77
77 -
 78
78 -
 79
79 -
 80
80 -
 81
81 -
 82
82 -
 83
83 -
 84
84 -
 85
85 -
 86
86 -
 87
87 -
 88
88 -
 89
89 -
 90
90 -
 91
91 -
 92
92 -
93
-
94
-
95
-
96
-
97
-
98
-
99
-
100
-
101
-
102
-
103
-
104
-
105
-
106
-
107
-
108
-
109
-
110
-
111
-
112
-
113
-
114
-
115
-
116
-
117
-
118
-
119
-
120
-
121
-
122
-
123
-
124
-
125
-
126
-
127
-
128
-
129
-
130
-
131
-
132
-
133
-
134
-
135
-
136
-
137
-
138
-
139
-
140
-
141
-
142
-
143
-
144
-
145
-
146
-
147
-
148
-
149
-
150
-
151
-
152
-
153
-
154
-
155
-
156
-
157
-
158
-
159
-
160
-
161
-
162
-
163
-
164
-
165
-
166
-
167
-
168
-
169
-
170
-
171
-
172
-
173
-
174
-
175
-
176
-
177
-
178
-
179
-
180
-
181
-
182
-
183
-
184
-
185
-
186
-
187
-
188
-
189
-
190
-
191
-
192
-
193
-
194
-
195
-
196
 |
 |

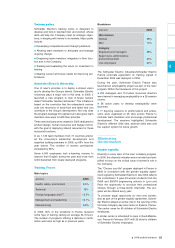
Business review
Schneider Electric’s commitment with this council, cre-
ated in 1997, goes far beyond legal requirements. To
give members an overall view of the Company and a
good understanding of its business, Schneider Electric
offers training, provides access to electronic resources
and organizes plant tours, among other things. A five-
day training session is organized for all new members
to provide a panorama of the Group’s operations and
business environment.
Collective agreements
In 2006, 39 agreements were signed with labor unions
in France (versus 11 in 2005), of which four were
Group agreements.These agreements covered a wide
range of issues, including the creation of a Group
negotiating body, mutualized profit-based incentive
programs and profit sharing plans (Schneider Electric
Industries and Schneider Electric France) and appren-
ticeships.
People Scope
To achieve new2’s goal of "improving together",
Schneider Electric leverages the People Scope inter-
nal satisfaction survey, which also serves as a refer-
ence for benchmarking with other companies. As of
August 31, 2006, all the Operating Divisions and Busi-
ness Units had responded to the survey’s 56 ques-
tions. Some 78,600 employees expressed their opin-
ions, for a response rate of 78%. Topics receiving the
most positive ratings included safety, personal involve-
ment and the Group’s societal commitment.
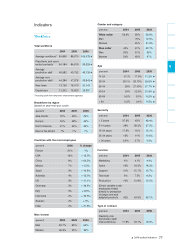
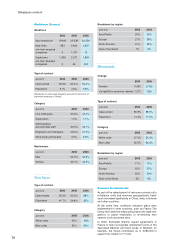
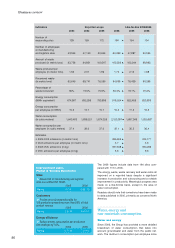
Health and safety
Health/safety
2004 2005 2006
Frequency rate 22.8 16.7 9.8
Severity rate 0.19 0.16 0.10
Accidents by category
2006
Total accidents 1,936
Fatal accidents 3*
Serious accidents 346
Minor accidents 1,587
* The three fatalities in 2006 occurred during commutes
(one in China, one in Thailand and one in the United States).
Detailed information on the Group’s health/safety
improvement plan is provided on page 76.
Health and retirement coverage
2006
Supplementary coverage
offered by the Company *
Unemployment 5.2%
Social security pension benefits 26.1%
Supplementary pension benefits 35.2%
Work accidents – benefits in kind 12.4%
Work accidents – cash benefits 19.3%
Illness – benefits in kind 35.4%
Illness – cash benefits 41.3%
Life insurance
(death coverage and survivor benefits) 60.8%
Disability 49.6%
Family allowances - benefits 16.0%
* Percentage of units declaring that they offer supplementary
coverage in relation to current legislation for the items listed.
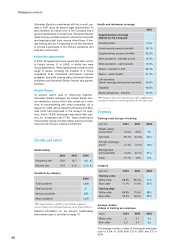
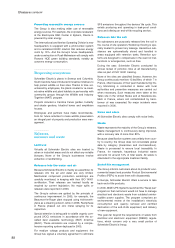
Training costs by type of training
(percent)
2004 2005 2006
Health, safety,
environment 10.6% 8.9% 7%
Technical 38.7% 33
.
3% 30%
Foreign languages
and IT 17.2% 13.1% 13%
Management
and leadership 14.8% 24.7% 31%
Other 18.7% 20% 19%
Category
(percent)
2004 2005 2006
Training costs
White collar 88.9% 88.4% 77%
Blue collar 11.1% 11.6% 23%
Training days
White collar 69.8% 70.4% 68%
Blue collar 30.2% 29.6% 32%
Training
Average number
of days of training per employee
(days)
2004 2005 2006
White collar 4 4.7 4.4
Blue collar 2.2 2.1 2.5
The average number of days of training per employee
rose to 3.8in 2006 from 3.6 in 2005 and 3.3 in
2004.
80