APC 2006 Annual Report Download - page 113
Download and view the complete annual report
Please find page 113 of the 2006 APC annual report below. You can navigate through the pages in the report by either clicking on the pages listed below, or by using the keyword search tool below to find specific information within the annual report.-
 1
1 -
2
-
3
-
4
-
5
-
6
-
7
-
8
-
9
-
10
-
11
-
12
-
13
-
14
-
15
-
16
-
17
-
18
-
19
-
20
-
21
-
22
-
23
-
24
-
25
-
26
-
27
-
28
-
29
-
30
-
31
-
32
-
33
-
34
-
35
-
36
-
37
-
38
-
39
-
40
-
41
-
42
-
43
-
44
-
45
-
46
-
47
-
48
-
49
-
50
-
51
-
52
-
53
-
54
-
55
-
56
-
57
-
58
-
59
-
60
-
61
-
62
-
63
-
64
-
65
-
66
-
67
-
68
-
69
-
70
-
71
-
72
-
73
-
74
-
75
-
76
-
77
-
78
-
79
-
80
-
81
-
82
-
83
-
84
-
85
-
86
-
87
-
88
-
89
-
90
-
91
-
92
-
93
-
94
-
95
-
96
-
97
-
98
-
99
-
100
-
101
-
102
-
 103
103 -
 104
104 -
 105
105 -
 106
106 -
 107
107 -
 108
108 -
 109
109 -
 110
110 -
 111
111 -
 112
112 -
 113
113 -
 114
114 -
 115
115 -
 116
116 -
 117
117 -
 118
118 -
 119
119 -
 120
120 -
 121
121 -
 122
122 -
 123
123 -
124
-
125
-
126
-
127
-
128
-
129
-
130
-
131
-
132
-
133
-
134
-
135
-
136
-
137
-
138
-
139
-
140
-
141
-
142
-
143
-
144
-
145
-
146
-
147
-
148
-
149
-
150
-
151
-
152
-
153
-
154
-
155
-
156
-
157
-
158
-
159
-
160
-
161
-
162
-
163
-
164
-
165
-
166
-
167
-
168
-
169
-
170
-
171
-
172
-
173
-
174
-
175
-
176
-
177
-
178
-
179
-
180
-
181
-
182
-
183
-
184
-
185
-
186
-
187
-
188
-
189
-
190
-
191
-
192
-
193
-
194
-
195
-
196
 |
 |

111
5
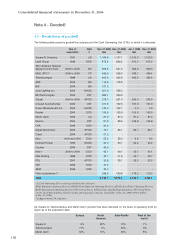
4.2 - Changes in goodwill
The main movements between December 31, 2005
and December 31, 2006 are summarized in the follow-
ing table:
2006 2005
Net goodwill at opening 5,878.8 4,539.0
Acquisitions 727.7 * 1,079.5
Disposals (1.5) -
Impairment - (8.4)
Translation adjustment (323.8) 301.5
Reclassifications (95
.
5) (32.8)
Net goodwill at year end 6,185.7 5,878.8
Cumulative impairment (8.4) (8.4)
*On the basis of the exchange rate on the acquisition date.
Acquisitions
Acquisitions primarily included Invensys Building Sys-
tems (IBS) and Silicon Power Corporation (Crydom) in
North America, Clipsal Asia and Citect in Asia-Pacific,
and OVA Bargellini SpA., AEM SA, GET Group Plc,
and Merten GmbH & Co Kg in Europe.
Other changes
Adjustments to the provisional accounting for the BEI
Technologies Inc business combination when the initial
accounting was completed led to the recognition in
2006 of intangible assets of $141.8 million (117.9
million), of which $42.3 million (35.2 million) for the
trademark and $80.5 million (66.9 million) for the dis-
tribution network. This led to the recognition of $55.2
million (44.5 million) for deferred tax liabilities.
Impairment tests did not reveal any losses on goodwill
recognized in the balance sheet.
The main exchange rate fluctuations concerned good-
will in US dollars.
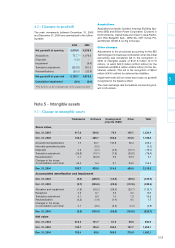
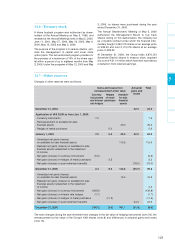
Note 5 - Intangible assets
5.1 - Change in intangible assets
Trademarks Software Development Other Total
projects (R&D)
Gross value
Dec. 31, 2004 617.8 390.6 76.9 145.1 1,230.4
Dec. 31, 2005 744.4 486.7 186.8 310.6 1,728.5
Acquisitions/Capitalization 1.5 20.7 120.8 82.4 225.4
Internally generated assets - (0.2) - - (0.2)
Disposals 0.2 (4.7) (4.5) (10.1) (19.1)
Translation adjustment (26.9) (10.1) (7.8) (33.6) (78.4)
Reclassification 0.1 (60.8) 9.5 53.3 2.1
Changes in the scope
of consolidation and other 46.4 6.4 9.7 93.0 155.5
Dec. 31, 2006 765.7 438.0 314.5 495.6 2,013.8
Accumulated amortization and impairment
Dec. 31, 2004 (2.5) (228.9) (15.0) (89.5) (335.9)
Dec. 31, 2005 (3.7) (290.8) (22.0) (112.9) (429.4)
Allocation and impairment (1.8) (59.2) (29.0) (25.7) (115.7)
Recapture 0.2 6.7 2.5 3.2 12.6
Translation adjustment 0.1 8.0 1.5 7.3 16.9
Reclassification (0.2) (1.4) (1.4) 4.5 1.5
Changes in the scope
of consolidation and other 0.1 (3.5) (2.2) (1.2) (6.8)
Dec. 31, 2006 (5.3) (340.0) (50.6) (124.8) (520.7)
Net value
Dec. 31, 2004 615.3 161.7 61.9 55.6 894.5
Dec. 31, 2005 740.7 195.9 164.8 197.7 1,299.1
Dec. 31, 2006 760.4 98.0 263.9 370.8 1,493.1