APC 2006 Annual Report Download - page 98
Download and view the complete annual report
Please find page 98 of the 2006 APC annual report below. You can navigate through the pages in the report by either clicking on the pages listed below, or by using the keyword search tool below to find specific information within the annual report.-
 1
1 -
2
-
3
-
4
-
5
-
6
-
7
-
8
-
9
-
10
-
11
-
12
-
13
-
14
-
15
-
16
-
17
-
18
-
19
-
20
-
21
-
22
-
23
-
24
-
25
-
26
-
27
-
28
-
29
-
30
-
31
-
32
-
33
-
34
-
35
-
36
-
37
-
38
-
39
-
40
-
41
-
42
-
43
-
44
-
45
-
46
-
47
-
48
-
49
-
50
-
51
-
52
-
53
-
54
-
55
-
56
-
57
-
58
-
59
-
60
-
61
-
62
-
63
-
64
-
65
-
66
-
67
-
68
-
69
-
70
-
71
-
72
-
73
-
74
-
75
-
76
-
77
-
78
-
79
-
80
-
81
-
82
-
83
-
84
-
85
-
86
-
87
-
 88
88 -
 89
89 -
 90
90 -
 91
91 -
 92
92 -
 93
93 -
 94
94 -
 95
95 -
 96
96 -
 97
97 -
 98
98 -
 99
99 -
 100
100 -
 101
101 -
 102
102 -
 103
103 -
 104
104 -
 105
105 -
 106
106 -
 107
107 -
 108
108 -
109
-
110
-
111
-
112
-
113
-
114
-
115
-
116
-
117
-
118
-
119
-
120
-
121
-
122
-
123
-
124
-
125
-
126
-
127
-
128
-
129
-
130
-
131
-
132
-
133
-
134
-
135
-
136
-
137
-
138
-
139
-
140
-
141
-
142
-
143
-
144
-
145
-
146
-
147
-
148
-
149
-
150
-
151
-
152
-
153
-
154
-
155
-
156
-
157
-
158
-
159
-
160
-
161
-
162
-
163
-
164
-
165
-
166
-
167
-
168
-
169
-
170
-
171
-
172
-
173
-
174
-
175
-
176
-
177
-
178
-
179
-
180
-
181
-
182
-
183
-
184
-
185
-
186
-
187
-
188
-
189
-
190
-
191
-
192
-
193
-
194
-
195
-
196
 |
 |

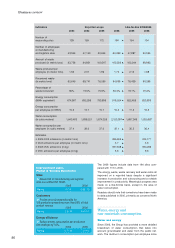
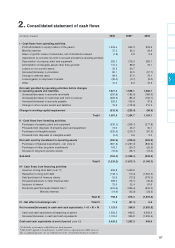
(in millions of euros except for earnings per share)
2006 2005* 2004
Revenue
(note 22)
13,729.7 11,678.8 10,349.3
Cost of sales (8,050.6) (6,923.8) (6,177.4)
Gross profit 5,679.1 4,755.0 4,171.9
Research and development expenses
(note 23)
(327.6) (273.7) (295.1)
Selling, general and administrative expenses (3,234.8) (2,812.8) (2,549.7)
Other operating income and expenses
(note 25)
(116.0) (103.2) (40.7)
Operating profit 2,000.7 1,565.3 1,286.4
Finance costs, net (104.0) (103.1) (64.4)
Other financial income and expenses (16.9) (1.5) 5.1
F
inance costs and other financial income and expense, net
(note 26)
(120.9) (104.6) (59.3)
Share of profit /(losses) of associates
(note 7)
1.9 (3.6) (3.6)
Profit before tax 1,881.7 1,457.1 1,223.5
Income tax expense
(note 12)
(535.1) (427.5) (365.2)
Profit of continuing operations 1,346.6 1,029.5 858.3
Discontinued operations
Profit for the period 1,346.6 1,029.5 858.3
– Attributable to equity holders of the parent 1,309.4 994.3 823.9
– Attributable to minority interests 37.2 35.2 34.4
Basic earnings per share (in euros)
(note 14.3)
5.95 4.56 3.73
Diluted earnings per share (in euros)
(note 14.3)
5.90 4.54 3.72
* IAS 32/39 applied as from January 1, 2005 with no adjustment for 2004 (note 2).
The accompanying notes are an integral part of the consolidated financial statements.
1. Consolidated statement of income
Consolidated financial statements at December 31, 2006
96