APC 2006 Annual Report Download - page 80
Download and view the complete annual report
Please find page 80 of the 2006 APC annual report below. You can navigate through the pages in the report by either clicking on the pages listed below, or by using the keyword search tool below to find specific information within the annual report.-
 1
1 -
2
-
3
-
4
-
5
-
6
-
7
-
8
-
9
-
10
-
11
-
12
-
13
-
14
-
15
-
16
-
17
-
18
-
19
-
20
-
21
-
22
-
23
-
24
-
25
-
26
-
27
-
28
-
29
-
30
-
31
-
32
-
33
-
34
-
35
-
36
-
37
-
38
-
39
-
40
-
41
-
42
-
43
-
44
-
45
-
46
-
47
-
48
-
49
-
50
-
51
-
52
-
53
-
54
-
55
-
56
-
57
-
58
-
59
-
60
-
61
-
62
-
63
-
64
-
65
-
66
-
67
-
68
-
69
-
 70
70 -
 71
71 -
 72
72 -
 73
73 -
 74
74 -
 75
75 -
 76
76 -
 77
77 -
 78
78 -
 79
79 -
 80
80 -
 81
81 -
 82
82 -
 83
83 -
 84
84 -
 85
85 -
 86
86 -
 87
87 -
 88
88 -
 89
89 -
 90
90 -
91
-
92
-
93
-
94
-
95
-
96
-
97
-
98
-
99
-
100
-
101
-
102
-
103
-
104
-
105
-
106
-
107
-
108
-
109
-
110
-
111
-
112
-
113
-
114
-
115
-
116
-
117
-
118
-
119
-
120
-
121
-
122
-
123
-
124
-
125
-
126
-
127
-
128
-
129
-
130
-
131
-
132
-
133
-
134
-
135
-
136
-
137
-
138
-
139
-
140
-
141
-
142
-
143
-
144
-
145
-
146
-
147
-
148
-
149
-
150
-
151
-
152
-
153
-
154
-
155
-
156
-
157
-
158
-
159
-
160
-
161
-
162
-
163
-
164
-
165
-
166
-
167
-
168
-
169
-
170
-
171
-
172
-
173
-
174
-
175
-
176
-
177
-
178
-
179
-
180
-
181
-
182
-
183
-
184
-
185
-
186
-
187
-
188
-
189
-
190
-
191
-
192
-
193
-
194
-
195
-
196
 |
 |
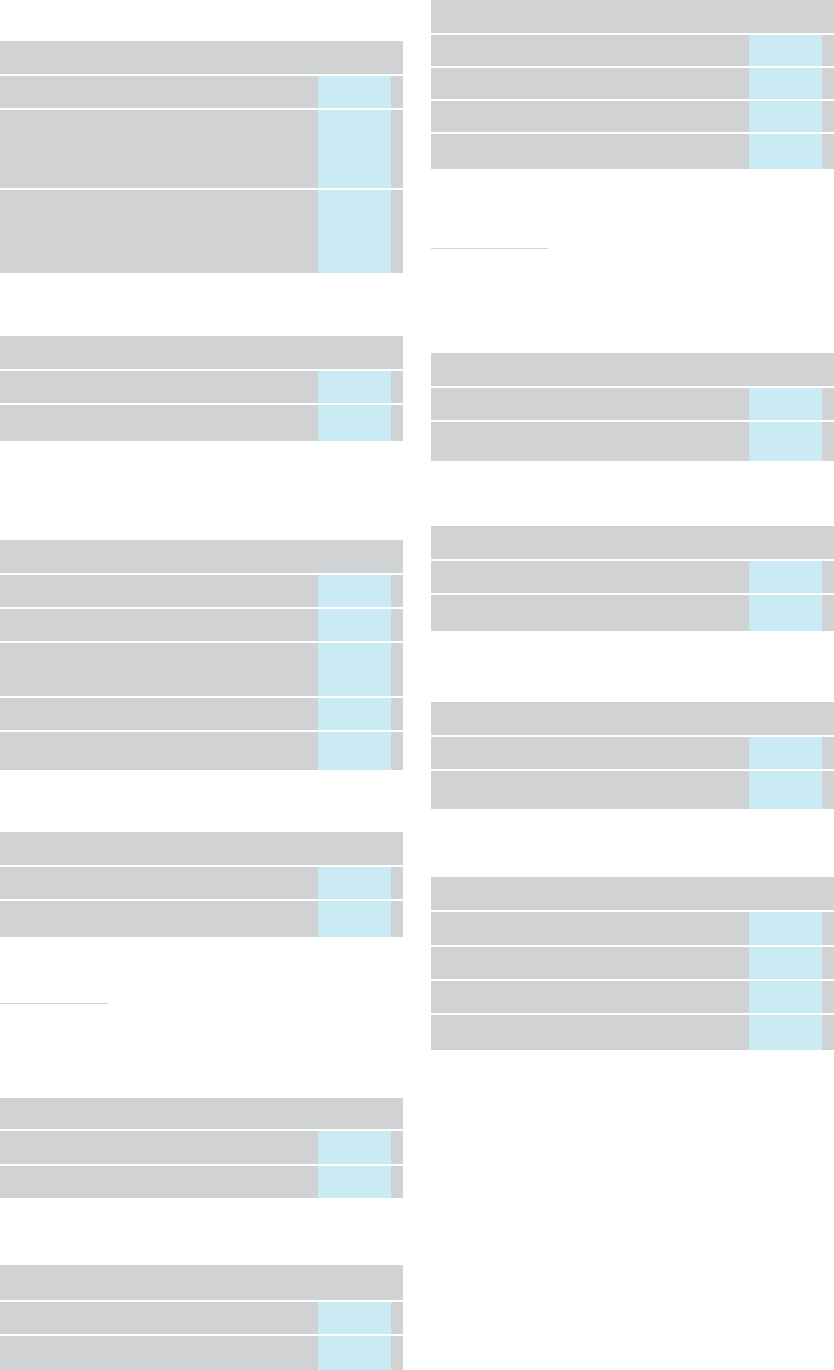
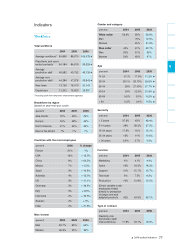
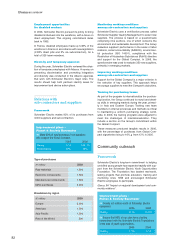
New hires
Category
(percent)
2005 2006
White collar 45% 48%
Blue collar 55% 52%
Breakdown by region
(percent)
2005 2006
Asia-Pacific 25% 29%
Europe 27% 28%
North America 41% 34%
Rest of the World 7% 9%
Type of contract
(percent)
2004 2005 2006
Open-ended 58.3% 65.2% 68%
Fixed-term 41.7% 34.8% 32%
Workforce
2004 2005 2006
Spot headcount 19,843 20,538 20,364
New hires 883 2,842 1,637
o/w from acquired
companies 0 1,197 13
Departures 1,908 2,337 1,864
o/w from divested
companies 0 54 253
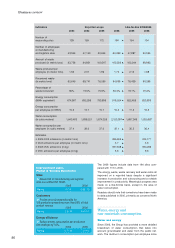
Type of contract
(percent)
2004 2005 2006
Open-ended 96.9% 95.4% 94.4%
Fixed-term 3.1% 4.6% 5.6%
Individuals on work-study programs account for two-thirds of
fixed-term contracts in France.
Men/women
(percent)
2005 2006
Men 64.3% 64.8%
Women 35.7% 35.2%
Category
(percent)
2005 2006
Line employees 35.6% 34.4%
Supervisors 1.2% 1.1%
Administrative
and technical staff 33.5% 33.1%
Engineers and managers 26.5% 27.5%
Work-study participants 3.2% 3.9%
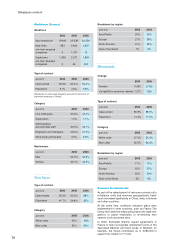
Business review
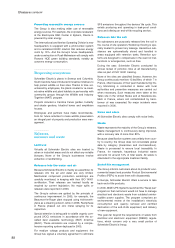
Category
(percent)
2005 2006
White collar 37.5% 35.4%
Blue collar 62.5% 64.6%
Breakdown by region
(percent)
2005 2006
Asia-Pacific 17% 15%
Europe 25% 27%
North America 52% 50%
Rest of the World 6% 8%
Dismissals
Type of contract
(percent)
2005 2006
Open-ended 85.8% 88.5%
Fixed-term 14.2% 11.5%
Change
2005 2006
Number 4,460 3,795
o
/w layoffs for economic reasons
1,070 620
Workforce (France)
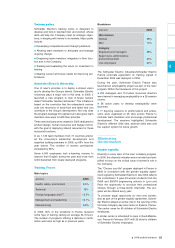
Reasons for dismissals
As part of the redeployment of resources carried out to
re-balance costs and revenues geographically, head-
count increased significantly in China, India, Indonesia
and other countries.
At the same time, workforce reduction plans were
implemented in other countries, such as France. The
Group took assertive steps going beyond its legal obli-
gations to assist employees in re-directing their
careers at all concerned sites.
In 2006, Schneider Electric signed agreements in
France to help re-invigorate employment pools in the
depressed Barentin and Dijon areas. In Barentin, for
example, the Group contributed up to 280,000 to
support the creation of 77 jobs.
78