APC 2006 Annual Report Download - page 112
Download and view the complete annual report
Please find page 112 of the 2006 APC annual report below. You can navigate through the pages in the report by either clicking on the pages listed below, or by using the keyword search tool below to find specific information within the annual report.-
 1
1 -
2
-
3
-
4
-
5
-
6
-
7
-
8
-
9
-
10
-
11
-
12
-
13
-
14
-
15
-
16
-
17
-
18
-
19
-
20
-
21
-
22
-
23
-
24
-
25
-
26
-
27
-
28
-
29
-
30
-
31
-
32
-
33
-
34
-
35
-
36
-
37
-
38
-
39
-
40
-
41
-
42
-
43
-
44
-
45
-
46
-
47
-
48
-
49
-
50
-
51
-
52
-
53
-
54
-
55
-
56
-
57
-
58
-
59
-
60
-
61
-
62
-
63
-
64
-
65
-
66
-
67
-
68
-
69
-
70
-
71
-
72
-
73
-
74
-
75
-
76
-
77
-
78
-
79
-
80
-
81
-
82
-
83
-
84
-
85
-
86
-
87
-
88
-
89
-
90
-
91
-
92
-
93
-
94
-
95
-
96
-
97
-
98
-
99
-
100
-
101
-
 102
102 -
 103
103 -
 104
104 -
 105
105 -
 106
106 -
 107
107 -
 108
108 -
 109
109 -
 110
110 -
 111
111 -
 112
112 -
 113
113 -
 114
114 -
 115
115 -
 116
116 -
 117
117 -
 118
118 -
 119
119 -
 120
120 -
 121
121 -
 122
122 -
123
-
124
-
125
-
126
-
127
-
128
-
129
-
130
-
131
-
132
-
133
-
134
-
135
-
136
-
137
-
138
-
139
-
140
-
141
-
142
-
143
-
144
-
145
-
146
-
147
-
148
-
149
-
150
-
151
-
152
-
153
-
154
-
155
-
156
-
157
-
158
-
159
-
160
-
161
-
162
-
163
-
164
-
165
-
166
-
167
-
168
-
169
-
170
-
171
-
172
-
173
-
174
-
175
-
176
-
177
-
178
-
179
-
180
-
181
-
182
-
183
-
184
-
185
-
186
-
187
-
188
-
189
-
190
-
191
-
192
-
193
-
194
-
195
-
196
 |
 |
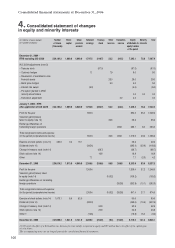
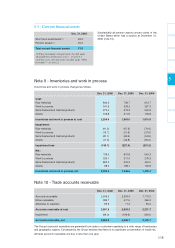
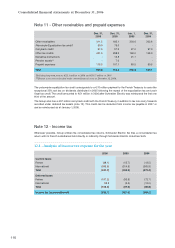
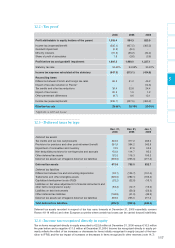
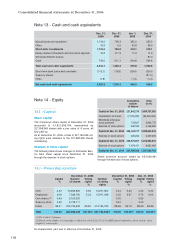
Consolidated financial statements at December 31, 2006
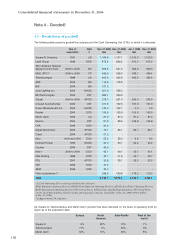
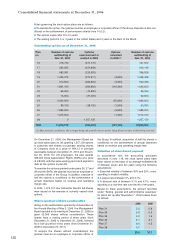
Note 4 - Goodwill
4.1 - Breakdown of goodwill
The following table presents goodwill by company and the Cash Generating Unit (CGU) to which it is allocated:
Year of CGU
Dec. 31, 2006 Dec. 31, 2005 Jan. 1, 2005 Dec. 31, 2004
acquisition (1) Net Net Net Net
Square D Company 1991 (A) 1,044.8 1,167.1 1,010.0 1,010.0
Lexel Group 1999 EOD 873.4 869.2 872.5 872.5
TAC/ Andover/ Abacus/
Applied Control Tech. 2003 to 2006 BA 605.8 637.2 563.9 563.9
MGE UPS (2) 2000 to 2006 CP 545.5 559.0 546.1 469.4
Telemecanique 1988 (A) 462.6 462.6 462.6 462.6
ABS 2005 BA 113.9 118.8 - -
IBS 2006 BA 197.2 - - -
Juno Lighting Inc. 2005 NAOD 301.0 335.2 - -
BEI Technologies 2005 CST 283.1 390.3 - -
Clipsal 2004 to 2006 APOD 278.0 261.0 245.0 245.0
Crouzet Automatismes 2000 CST 161.8 162.6 161.9 161.9
Power Measurement Inc. 2005 NAOD 145.0 162.7 0.0 0.0
Positec 2000 EOD 105.9 105.9 105.9 105.9
Merlin Gerin 1992 (A) 87.2 87.2 87.2 87.2
Kavlico 2004 CST 81.6 89.6 106.9 106.9
OVA 2006 EOD 80.0 - - -
Digital Electronics 2002 APOD 76.1 84.1 83.7 83.7
Citect 2006 APOD 67.2 - - -
Elau 2004 and 2005 EOD 55.6 55.3 6.6 6.6
Federal Pioneer 1990 NAOD 54.0 60.1 50.2 50.2
Crydom 2006 CST 43.9 - - -
Infra + 2000 to 2004 EOD 43.1 43.1 43.1 43.1
Mita Holding 1999 EOD 34.7 41
.
9 40.7 40.7
PDL 2001 APOD 32.8 35.1 33.5 33.5
GET 2006 EOD 31.6 - - -
AEM 2006 EOD 30.4 - - -
Other subsidiaries (3) 349.5 150.8 119.2 119.2
Total 6,185.7 5,878.8 4,539.0 4,462.3
(1) Cash Generating Unit to which goodwill has been allocated.
EOD: European Operating Division, NAOD: North American Operating Division, APOD: Asia-Pacific Operating Division,
IIOD: International Operating Division, CST: Custom Sensors &Technologies, BA: Building Automation, CP: Critical Power.
(2) Of which €32.0 million related to the put option granted to minority shareholders at Dec. 31, 2006 (€75.4 million
at Dec. 31, 2005).
(3) Approximately 50 companies.
Europe North Asia-Pacific Rest of the
America world
Square D 9% 80% 10% 1%
Telemecanique 71% 0% 20% 9%
Merlin Gerin 62% 10% 20% 8%
(A) Square D, Telemecanique and Merlin Gerin goodwill has been allocated on the basis of operating profit by
region as of the acquisition date:
110