APC 2006 Annual Report Download - page 133
Download and view the complete annual report
Please find page 133 of the 2006 APC annual report below. You can navigate through the pages in the report by either clicking on the pages listed below, or by using the keyword search tool below to find specific information within the annual report.-
 1
1 -
2
-
3
-
4
-
5
-
6
-
7
-
8
-
9
-
10
-
11
-
12
-
13
-
14
-
15
-
16
-
17
-
18
-
19
-
20
-
21
-
22
-
23
-
24
-
25
-
26
-
27
-
28
-
29
-
30
-
31
-
32
-
33
-
34
-
35
-
36
-
37
-
38
-
39
-
40
-
41
-
42
-
43
-
44
-
45
-
46
-
47
-
48
-
49
-
50
-
51
-
52
-
53
-
54
-
55
-
56
-
57
-
58
-
59
-
60
-
61
-
62
-
63
-
64
-
65
-
66
-
67
-
68
-
69
-
70
-
71
-
72
-
73
-
74
-
75
-
76
-
77
-
78
-
79
-
80
-
81
-
82
-
83
-
84
-
85
-
86
-
87
-
88
-
89
-
90
-
91
-
92
-
93
-
94
-
95
-
96
-
97
-
98
-
99
-
100
-
101
-
102
-
103
-
104
-
105
-
106
-
107
-
108
-
109
-
110
-
111
-
112
-
113
-
114
-
115
-
116
-
117
-
118
-
119
-
120
-
121
-
122
-
 123
123 -
 124
124 -
 125
125 -
 126
126 -
 127
127 -
 128
128 -
 129
129 -
 130
130 -
 131
131 -
 132
132 -
 133
133 -
 134
134 -
 135
135 -
 136
136 -
 137
137 -
 138
138 -
 139
139 -
 140
140 -
 141
141 -
 142
142 -
 143
143 -
144
-
145
-
146
-
147
-
148
-
149
-
150
-
151
-
152
-
153
-
154
-
155
-
156
-
157
-
158
-
159
-
160
-
161
-
162
-
163
-
164
-
165
-
166
-
167
-
168
-
169
-
170
-
171
-
172
-
173
-
174
-
175
-
176
-
177
-
178
-
179
-
180
-
181
-
182
-
183
-
184
-
185
-
186
-
187
-
188
-
189
-
190
-
191
-
192
-
193
-
194
-
195
-
196
 |
 |

131
5
Europe North Asia- Rest of Total
America Pacific the world
December 31, 2006
Revenue (1) 6,402 3,698 2,514 1,116 13,730
EBIT 983 518 327 173 2,001
Capital employed (2) 6,052 3,866 1,922 443 12,283
December 31, 2005
Revenue (1) 5,644 3,047 2,031 958 11,679
EBIT 762 406 263 134 1,565
Capital employed (2) 5,272 3,873 1,718 435 11,298
December 31, 2004
Revenue (1) 5,266 2,501 1,828 754 10,349
EBIT 672 314 207 94 1,286
Capital employed (2) 4,949 2,155 1,531 346 8,981
(1) Based on destination of sales.
(2) Based on location of assets.
2006 2005 2005 2004
(1) restated reported reported
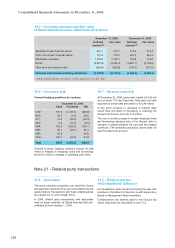
Revenue
Electrical distribution 8,605 7,307 7,307 6,509
Automation & control 4,456 3,802 2,892 2,717
Growth platforms 1,480 1,123
Critical power 668 570 - -
13,730 11,679 11,679 10,349
Operating margin (in %)
Electrical distribution 15.3% 13.9% 13.9% 12.8%
Automation & control 13.5% 12.6% 12.7% 12.0%
Growth platforms 12.2% 11.6%
Critical power 12.9% 12.1% - -
14.6% 13.4% 13.4% 12.4%
(1) Following the Group’s recent expansion in the Critical Power segment, this now represents a separate reportable business
segment.The businesses included in Growth Platforms in 2005 and 2004 have therefore been allocated between “Critical Power”
(MGE UPS) and “Automation and Control” (all other businesses: Building Automation and Custom Sensors).
Revenue and operating margin by business:
Note 22 - Segment information
The Group is divided into four operating divisions. Performance assessments and management decisions are
notably based on operating profit (earnings before interest and tax).
Geographical segment information is presented after allocating Critical Power data in 2006 and data for the
Growth Platforms (Building Automation, Critical Power and Custom Sensors) in 2005 and 2004. Details are pro-
vided in chapter 4 of the Annual Report (Business Review).