APC 2006 Annual Report Download - page 128
Download and view the complete annual report
Please find page 128 of the 2006 APC annual report below. You can navigate through the pages in the report by either clicking on the pages listed below, or by using the keyword search tool below to find specific information within the annual report.-
 1
1 -
2
-
3
-
4
-
5
-
6
-
7
-
8
-
9
-
10
-
11
-
12
-
13
-
14
-
15
-
16
-
17
-
18
-
19
-
20
-
21
-
22
-
23
-
24
-
25
-
26
-
27
-
28
-
29
-
30
-
31
-
32
-
33
-
34
-
35
-
36
-
37
-
38
-
39
-
40
-
41
-
42
-
43
-
44
-
45
-
46
-
47
-
48
-
49
-
50
-
51
-
52
-
53
-
54
-
55
-
56
-
57
-
58
-
59
-
60
-
61
-
62
-
63
-
64
-
65
-
66
-
67
-
68
-
69
-
70
-
71
-
72
-
73
-
74
-
75
-
76
-
77
-
78
-
79
-
80
-
81
-
82
-
83
-
84
-
85
-
86
-
87
-
88
-
89
-
90
-
91
-
92
-
93
-
94
-
95
-
96
-
97
-
98
-
99
-
100
-
101
-
102
-
103
-
104
-
105
-
106
-
107
-
108
-
109
-
110
-
111
-
112
-
113
-
114
-
115
-
116
-
117
-
 118
118 -
 119
119 -
 120
120 -
 121
121 -
 122
122 -
 123
123 -
 124
124 -
 125
125 -
 126
126 -
 127
127 -
 128
128 -
 129
129 -
 130
130 -
 131
131 -
 132
132 -
 133
133 -
 134
134 -
 135
135 -
 136
136 -
 137
137 -
 138
138 -
139
-
140
-
141
-
142
-
143
-
144
-
145
-
146
-
147
-
148
-
149
-
150
-
151
-
152
-
153
-
154
-
155
-
156
-
157
-
158
-
159
-
160
-
161
-
162
-
163
-
164
-
165
-
166
-
167
-
168
-
169
-
170
-
171
-
172
-
173
-
174
-
175
-
176
-
177
-
178
-
179
-
180
-
181
-
182
-
183
-
184
-
185
-
186
-
187
-
188
-
189
-
190
-
191
-
192
-
193
-
194
-
195
-
196
 |
 |

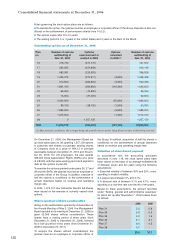
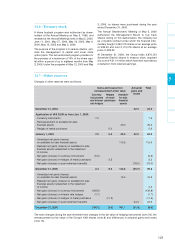
(a) Economic risks
These include tax risks arising from tax audits per-
formed by various local tax administrations and finan-
cial risks arising primarily on guarantees given to third
parties in relation to certain assets and liabilities.
During the year, the Group set aside provisions in an
amount of 38.0 million to cover delays and difficulties
in deploying information systems, notably the SAP
core model. The Group also acknowledged the Euro-
pean Commission’s decision concerning two former
subsidiaries’ alleged participation in a high voltage
switchgear cartel and set aside 8.1 million to cover
the related fine.
(b) Customer risks
These provisions primarily concern liability claims aris-
ing from alleged defects in products sold to customers
and other third parties and are determined on a case-
by-case basis. They also cover losses at the end of
various long-term contracts in an amount of 6.0 mil-
lion.
(c) Product risks
Provisions are recorded on a statistical basis for the
residual cost of product warranties not covered by
insurance. Such warranties may run up to 18 months.
The Group also recognizes provisions to cover dis-
putes concerning defective products and recalls of
clearly identified products.
In 2006, the provision was increased by 11 million to
cover newly identified technical risks. The related tech-
nical difficulties were being resolved as of December
31, 2006.
(d) Environmental risks
These provisions are primarily set aside to cover
potential reclamation costs.
No new risks were identified during site reviews in
2006.
(e) Restructuring
New provisions were set aside during the year to cover
the costs of restructuring plans in Europe (France,
United Kingdom, Italy) and in Australia (note 25).
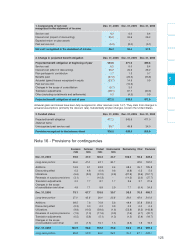
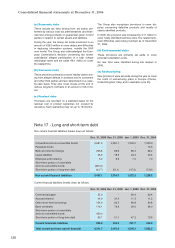
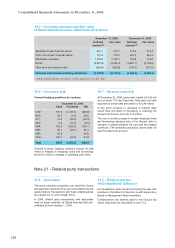
Note 17 - Long and short-term debt
Non current financial liabilities breaks down as follows:
Dec. 31, 2006 Dec. 31, 2005 Jan. 1, 2005 Dec. 31, 2004
Convertible and non-convertible bonds 3,687.9 2,691.1 1,200.0 1,200.0
Perpetual bonds - - - 73.3
Bank and other borrowings
253.8 89.9 89.2 68.2
Lease liabilities 23.9 18.5 23.4 23.4
Employee profit sharing 5.2 6.3 7.0 7.0
Short-term portion of convertible
and non-convertible bonds (450.0)
Short-term portion of long-term debt (63.7) (51.1) (47.2) (73.8)
Non current financial liabilities 3,457.1 2,754.7 1,272.5 1,298.2
Current financial liabilities breaks down as follows:
Dec. 31, 2006 Dec. 31, 2005 Jan. 1, 2005 Dec. 31, 2004
Commercial paper 55.0 - 60.4 60.4
Accrued interest 44.9 31.4 11.3 11.3
Other short-term borrowings 154.9 90.5 80.8 80.8
Bank overdrafts 116.1 79.9 28.0 28.0
Short-term portion of convertible
and non-convertible bonds 450.0
Short-term portion of long-term debt 63.7 51.1 47.2 73.8
Current financials liabilities 884.6 252.9 227.7 254.3
Total current and non current financial 4,341.7 3,007.6 1,500.2 1,552.5
Consolidated financial statements at December 31, 2006
126