APC 2006 Annual Report Download - page 129
Download and view the complete annual report
Please find page 129 of the 2006 APC annual report below. You can navigate through the pages in the report by either clicking on the pages listed below, or by using the keyword search tool below to find specific information within the annual report.-
 1
1 -
2
-
3
-
4
-
5
-
6
-
7
-
8
-
9
-
10
-
11
-
12
-
13
-
14
-
15
-
16
-
17
-
18
-
19
-
20
-
21
-
22
-
23
-
24
-
25
-
26
-
27
-
28
-
29
-
30
-
31
-
32
-
33
-
34
-
35
-
36
-
37
-
38
-
39
-
40
-
41
-
42
-
43
-
44
-
45
-
46
-
47
-
48
-
49
-
50
-
51
-
52
-
53
-
54
-
55
-
56
-
57
-
58
-
59
-
60
-
61
-
62
-
63
-
64
-
65
-
66
-
67
-
68
-
69
-
70
-
71
-
72
-
73
-
74
-
75
-
76
-
77
-
78
-
79
-
80
-
81
-
82
-
83
-
84
-
85
-
86
-
87
-
88
-
89
-
90
-
91
-
92
-
93
-
94
-
95
-
96
-
97
-
98
-
99
-
100
-
101
-
102
-
103
-
104
-
105
-
106
-
107
-
108
-
109
-
110
-
111
-
112
-
113
-
114
-
115
-
116
-
117
-
118
-
 119
119 -
 120
120 -
 121
121 -
 122
122 -
 123
123 -
 124
124 -
 125
125 -
 126
126 -
 127
127 -
 128
128 -
 129
129 -
 130
130 -
 131
131 -
 132
132 -
 133
133 -
 134
134 -
 135
135 -
 136
136 -
 137
137 -
 138
138 -
 139
139 -
140
-
141
-
142
-
143
-
144
-
145
-
146
-
147
-
148
-
149
-
150
-
151
-
152
-
153
-
154
-
155
-
156
-
157
-
158
-
159
-
160
-
161
-
162
-
163
-
164
-
165
-
166
-
167
-
168
-
169
-
170
-
171
-
172
-
173
-
174
-
175
-
176
-
177
-
178
-
179
-
180
-
181
-
182
-
183
-
184
-
185
-
186
-
187
-
188
-
189
-
190
-
191
-
192
-
193
-
194
-
195
-
196
 |
 |
127
5
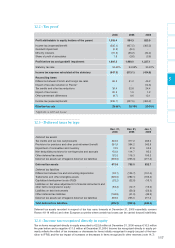
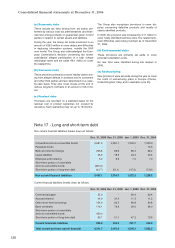
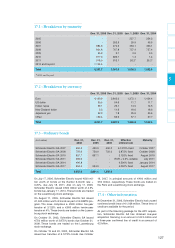
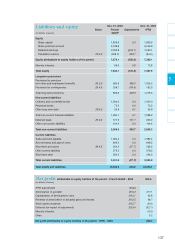
17.1 - Breakdown by maturity
Dec. 31, 2006 Dec. 31, 2005 Jan. 1, 2005 Dec. 31, 2004
2005 - - 227.7 254.3
2006 - 252.9 20.9 46.6
2007 884.6 470.5 463.1 463.1
2008 851.8 767.8 757.4 757.4
2009 25.9 3.7 3.5 3.5
2010 917.0 899.7 1.4 1.4
2011 518.0 613.1 26.2* 26.2*
2012 and beyond 1,144.4 - - -
Total 4,341.7 3,007.6 1,500.2 1,552.5
* 2011 and beyond
17.2 - Breakdown by currency
Dec. 31, 2006 Dec. 31, 2005 Jan. 1, 2005 Dec. 31, 2004
Euro 4,100.9 2,842.0 1,372.1 1,424.4
US dollar 30.5 54.6 11.7 11.7
Indian rupee 53.1 25.1 14.5 14.5
New Zealand dollar 2.5 11.6 18.6 18.6
Japanese yen 22.3 7.8 25.6 25.6
Other 132.4 66.6 57.7 57.7
Total 4,341.7 3,007.6 1,500.2 1,552.5
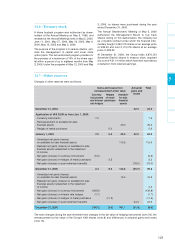
17.3 - Ordinary bonds
(in
€
million)
Dec. 31, Dec. 31, Dec. 31, Effective Maturity
2006 2005 2004 interest rate
Schneider Electric SA 2007 450.0 450.0 450.0 6.1275% fixed October 2007
Schneider Electric SA 2008 750.0 750.0 750.0 3.875% fixed October 2008
Schneider Electric SA 2010 897.7 897.1 - 3.125% fixed August 2010
Schneider Electric SA 2011 499.0 - - EUR + 0.2% variable July 2011
Schneider Electric SA 2014 496.8 - - 4.500% fixed January 2014
Schneider Electric SA 2017 594.4 594.0 - 4.000% fixed August 2017
Total 3,687.9 2,691.1 1,200.0
On July 17, 2006, Schneider Electric issued 500 mil-
lion worth of bonds at the Euribor 3-month rate +
0.20%, due July 18, 2011. Also on July 17, 2006,
Schneider Electric issued 500 million worth of 4.5%
bonds due January 17, 2014. These bonds are traded
on the Luxembourg stock exchange.
On August 11, 2005, Schneider Electric SA issued
1,500 million worth of bonds as part of its EMTN pro-
gram. The issue comprises a 900 million five-year
tranche at 3.125% and a 600 million twelve-year
tranche at 4%. These bonds are traded on the Luxem-
bourg stock exchange.
On October 31, 2003, Schneider Electric SA issued
750 million worth of 3.875% bonds due October 31,
2008. These bonds are traded on the Luxembourg
stock exchange.
On October 19 and 20, 2000, Schneider Electric SA
issued two tranches of 6.1275% bonds due October
19, 2007, in principal amounts of 400 million and
50 million, respectively. These bonds are traded on
the Paris and Luxembourg stock exchange.
17.4 - Other information
At December 31, 2006, Schneider Electric had unused
confirmed credit lines of 1,038 million. These lines of
credit are available for the period.
As part of the financing package for the APC acquisi-
tion, Schneider Electric SA has obtained one-year
acquisition financing in an amount of 2.5 billion and
a three-year confirmed line of credit in an amount of
2 billion.